NBA Turnovers Leaders 2025-26
The NBA turnovers per game leaders for the 2025-26 regular season, ranked on per-game averages across 246 qualified players. Luka Doncic (LAL) leads at 4.0 TO, ahead of Deni Avdija on 3.8 and Nikola Jokic on 3.7. Qualifying takes a minimum 57 games played, and the table shows games played beside every figure, 25 players to a page.
Updated
| Rank | Player | Team | GP | TURNOVER |
|---|---|---|---|---|
| 1 |  Luka Doncic Luka Doncic | LAL | 64 | 4.0 |
| 2 | 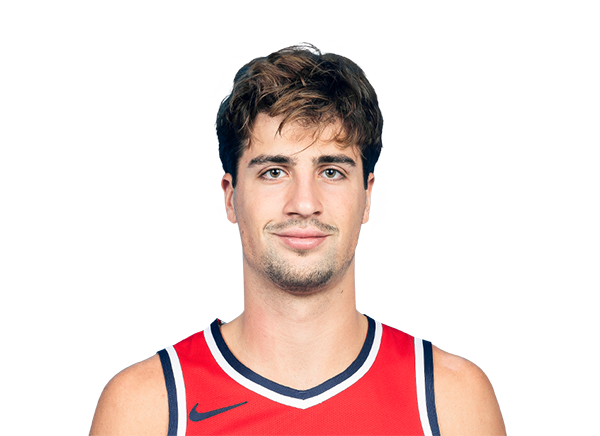 Deni Avdija Deni Avdija | POR | 66 | 3.8 |
| 3 | 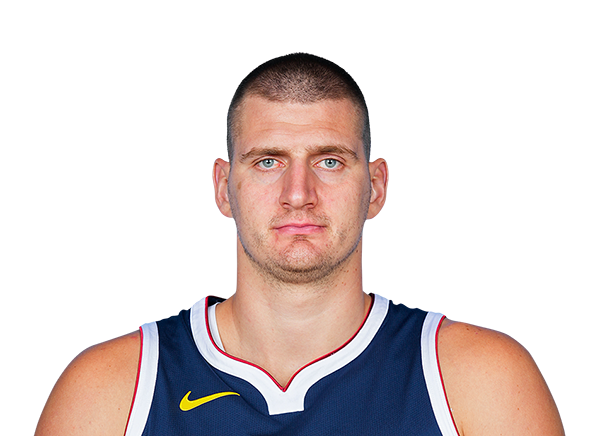 Nikola Jokic Nikola Jokic | DEN | 65 | 3.7 |
| 4 |  Cade Cunningham Cade Cunningham | DET | 64 | 3.7 |
| 5 |  Jaylen Brown Jaylen Brown | PHI | 71 | 3.6 |
| 6 |  James Harden James Harden | CLE | 70 | 3.5 |
| 7 | 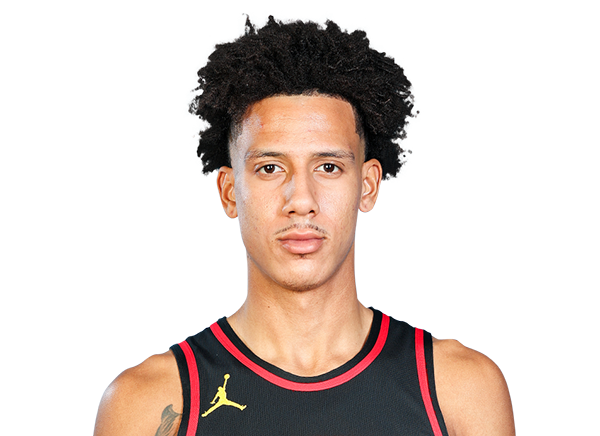 Jalen Johnson Jalen Johnson | ATL | 72 | 3.4 |
| 8 |  Russell Westbrook Russell Westbrook | SAC | 64 | 3.3 |
| 9 |  Kevin Durant Kevin Durant | HOU | 78 | 3.2 |
| 10 |  Alperen Sengun Alperen Sengun | HOU | 72 | 3.2 |
| 11 | SC Stephon Castle | SAS | 68 | 3.2 |
| 12 | 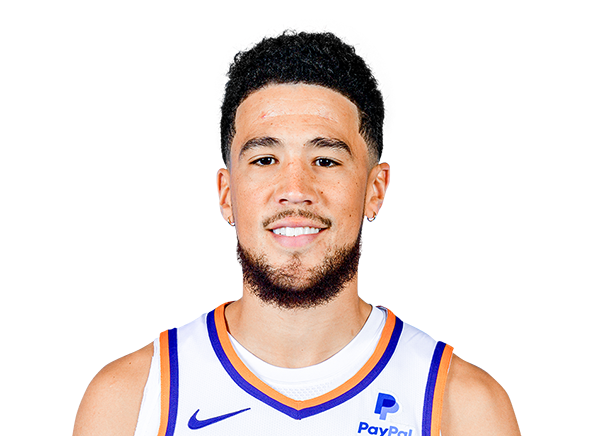 Devin Booker Devin Booker | PHX | 64 | 3.1 |
| 13 |  Paolo Banchero Paolo Banchero | ORL | 72 | 3.1 |
| 14 |  LeBron James LeBron James | PHI | 60 | 3.0 |
| 15 |  Anthony Edwards Anthony Edwards | MIN | 61 | 2.9 |
| 16 |  Donovan Mitchell Donovan Mitchell | CLE | 70 | 2.8 |
| 17 |  LaMelo Ball LaMelo Ball | MIN | 72 | 2.8 |
| 18 |  Julius Randle Julius Randle | BKN | 79 | 2.7 |
| 19 |  Ryan Rollins Ryan Rollins | MIL | 74 | 2.7 |
| 20 | DG Draymond Green | GSW | 68 | 2.7 |
| 21 |  Jalen Suggs Jalen Suggs | ORL | 57 | 2.7 |
| 22 |  Scottie Barnes Scottie Barnes | TOR | 80 | 2.6 |
| 23 | KT Karl-Anthony Towns | NYK | 75 | 2.5 |
| 24 | IC Isaiah Collier | UTA | 59 | 2.5 |
| 25 |  Brandon Miller Brandon Miller | CHA | 65 | 2.5 |
1–25 of 246
Who leads the NBA in turnovers per game?
Luka Doncic leads the NBA in turnovers per game at 4.0 TO across 64 games in 2025-26. Deni Avdija is second at 3.8, Nikola Jokic third at 3.7, Cade Cunningham fourth at 3.7 and Jaylen Brown fifth at 3.6. The table ranks 246 qualified players with games played beside every figure, and each name links through to the player's game log and prop hit rates.
How many players qualify for the NBA turnovers per game leaderboard?
246 players qualify for the NBA turnovers per game leaderboard in 2025-26, with a minimum 57 games played. That threshold mirrors the NBA's own rule of 70 percent of games for per-game titles. It is scaled to how much of the season has been played, so the list grows through the year. The table runs 25 players a page across 10 pages, sorted on the stat itself or on games played.
What is a strong turnovers per game figure in the NBA this season?
4.0 TO leads the league in turnovers per game this season. The fifth-ranked figure is 3.6 and the 25th on this page is 2.5, a gap of 0.4 TO from first to fifth. Anything above the fifth-ranked mark puts a player among the elite in turnovers per game. Anything above the last figure on this page keeps them in the top tier of 246 qualifiers. For prop research, set a player's line against these marks and against the last five games shown on the Statz leaders tables.