How to use Statz Player Projections
Overview
Statz Player Projections brings game-changing insights to individual player performance analysis. Unlike traditional stats that only show past performance, our advanced projection system forecasts expected output for each player in their upcoming fixture, helping you identify value in player prop markets, bet builders and fantasy football selections.
Where to Find Player Projections
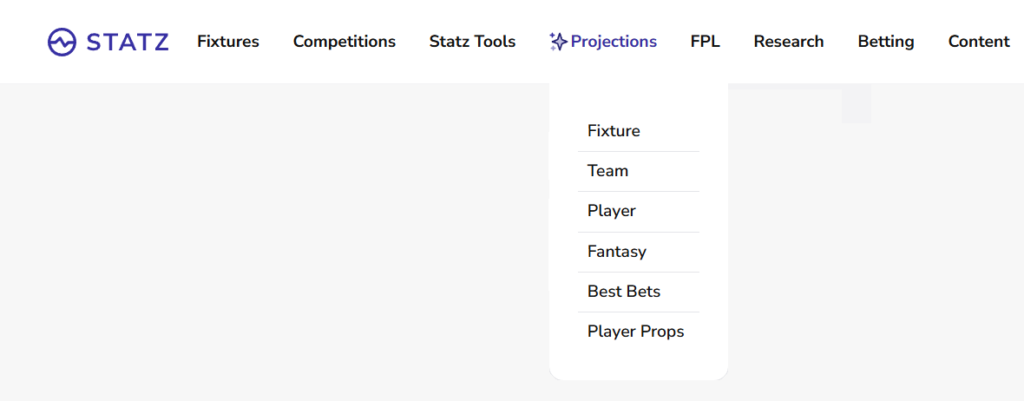
From the Statz homepage, click the “Projections” tab in the top menu bar, then select “Player” from the dropdown menu.
How to Use
Navigating and Understanding the Table
The Player Projections page features a clean, intuitive interface with powerful filtering options at the top and a comprehensive data table below. Located in the top-right corner, the league dropdown lets you switch between different competitions, with the Premier League being the default selection.
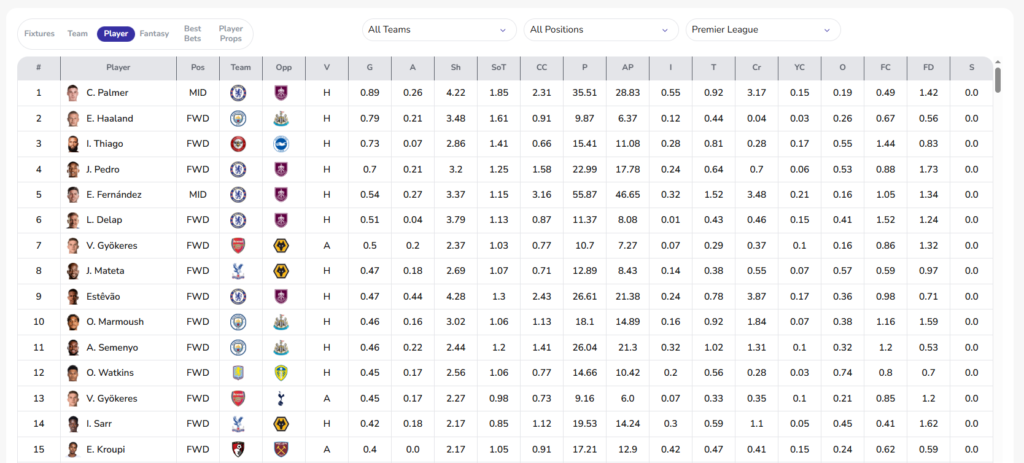
You can scroll horizontally across the table to view all available statistics and scroll vertically to see more players. Each column is sortable – simply click the column header to rank players by that specific metric. Here’s what they all stand for:
- V = Venue
- G = Goals
- A = Assists
- Sh = Shots
- SoT = Shots on Target
- CC = Chances Created
- P = Passes
- AP = Accurate Passes
- I = Interceptions
- T = Tackles
- Cr = Crosses
- YC = Yellow Cards
- O = Offsides
- FC = Fouls Committed
- FD = Fouls Drawn
- S = Saves
The Filter Dropdowns
All Teams Dropdown
This dropdown allows you to filter projections by specific clubs or view all teams at once. When you select “All Teams” (the default), you’ll see projected statistics for every player across all teams in the selected league.
Tip: You can filter by multiple teams, so if you’re researching a head-to-head matchup, pick both the home and away side to compare key projections.
All Positions Dropdown
Position filtering helps you narrow down your search to specific player roles, making it easier to compare like-for-like players.
Available positions:
- MID (Midfielders) – Central midfielders, Attacking midfielders, Defensive midfielders
- FWD (Forwards) – Strikers, Wingers
- DEF (Defenders) – Center backs, Full backs, Wing backs
- GK (Goalkeepers)
How to use it:
- Select “FWD” when researching goal-scoring prop bets
- Choose “MID” to find assist candidates or players likely to accumulate shots
- Filter to “DEF” when analysing clean sheet potential or tackle/interception markets
Reading and Interpreting the Projections
Our projections are presented as decimal numbers representing average expected totals. Our model uses recent player and team data to project and apportion team totals to players, assuming they start.
For example: A projection of 0.79 goals for Erling Haaland means if his fixture against Newcastle was played thousands of times, our model would expect him to average 0.79 goals per game – indicating a high probability of a goal.
Putting Player Projections Into Action
Example 1: Identifying Goal-Scoring Opportunities
Let’s say you want to find players likely to score this gameweek, by default the table is sorted by the G (Goals) column.
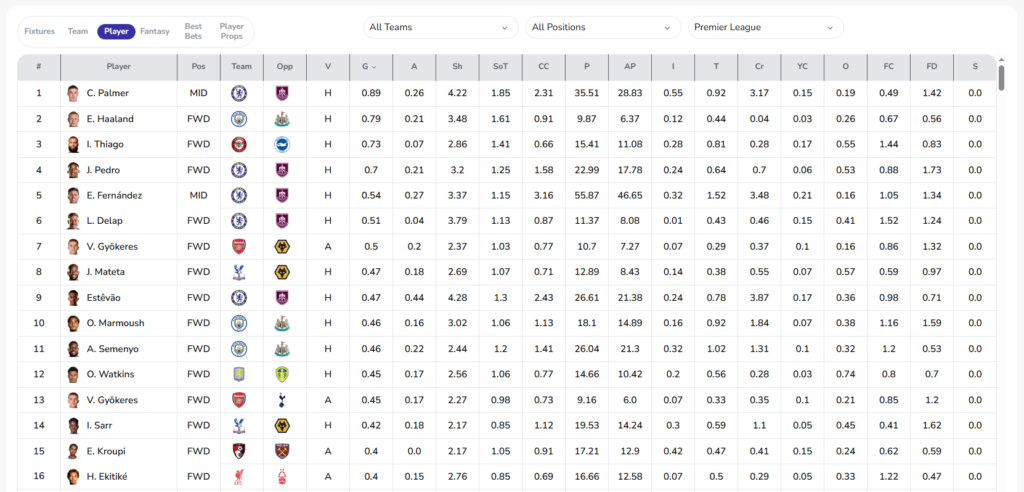
Looking at the top players in our screenshot:
- Cole Palmer (Chelsea vs Burnley): 0.89 projected goals
- Erling Haaland (Man City vs Newcastle): 0.79 projected goals
- Igor Thiago (Brentford vs Brighton): 0.73 projected goals
Palmer’s 0.89 goal projection is particularly strong along with his 0.26 assist projection, suggesting excellent value for goal involvement bets and Fantasy Premier League captain selection.
Cross-reference with shots: Palmer also projects for 4.22 shots and 1.85 shots on target, supporting the goal-scoring narrative with high volume.
Example 2: Finding Bet Builder Selections within a Fixture
Use the team dropdown to select the two teams playing each other and sort by your chosen market, for example, here we have Everton v Man United players sorted by the FC (Fouls Committed) column.
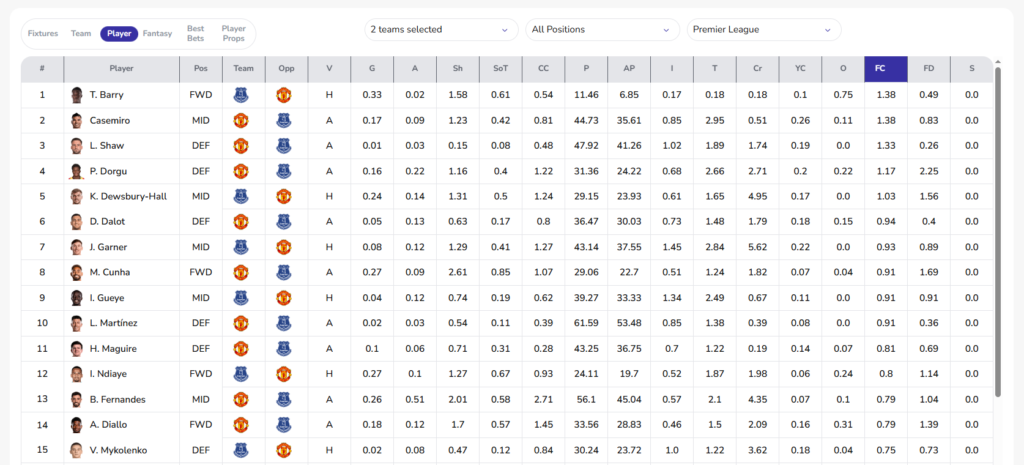
Looking at our data, the two most likely players to commit a foul are:
- Thierno Barry: 1.38 projected fouls
- Casemiro: 1.38 projected fouls
Visit our player props page to further understand where our projections show value compared to various bookmaker odds.
Example 3: Booking/Card Market Analysis
If you’re interested in player card markets, sort by YC (Yellow Cards) to find booking-prone players.
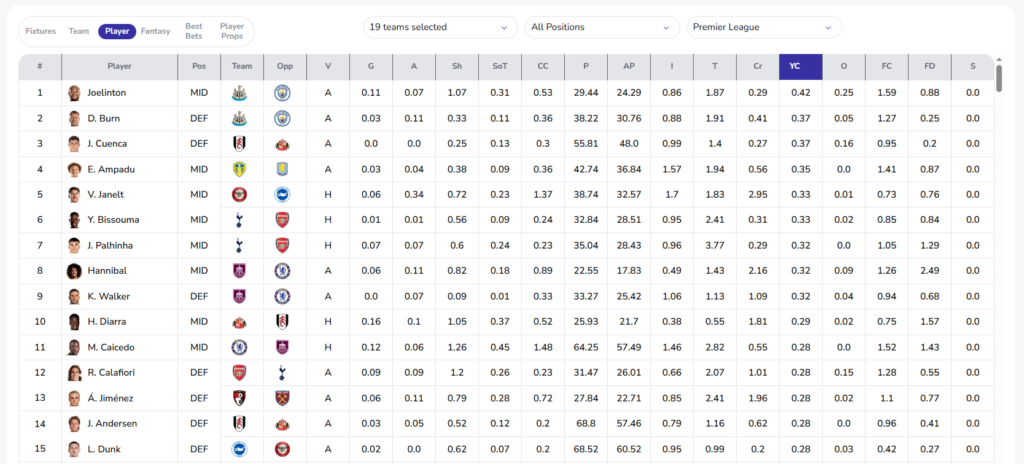
From our screenshot:
- Joelinton (Man City v Newcastle): 0.42 projected yellow cards
- Dan Burn (Man City v Newcastle): 0.37 projected yellow cards
- Jorge Cuenca (Sunderland v Fulham): 0.37 projected yellow cards
While these numbers seem low, in the context of card markets, a 0.42 projection represents roughly a 34% chance of a booking – which can offer value if bookmakers’ odds suggest lower probability. Combine with the fouls column for deeper insight.
Conclusion
The Statz Player Projections page is a powerful tool that synthesizes complex statistical analysis into actionable insights. By understanding each dropdown filter, interpreting the projection columns correctly, and combining multiple metrics intelligently, you can:
- Make smarter Fantasy Premier League decisions
- Identify value in player prop betting markets
- Understand individual matchups more deeply
- Save hours of manual research and calculation
Remember: projections are not guarantees for individual fixtures. Use them as the foundation of your research strategy, combining them with team news, tactical knowledge, and your own expertise.
Ready to find your edge? Visit statz.ai/projections/player today and start exploring the data that gives you an advantage in player analysis.