How to Use Statz Player Profile Page
Overview
The Statz Player Profile page gives you a complete statistical breakdown of any individual player across every competition they have featured in. Whether you are researching Cole Palmer’s shot volume for a bet builder, checking a striker’s goals-per-game rate, or comparing a midfielder’s fouls drawn across home and away fixtures, the Player Profile page puts everything in one place.
It is built for speed. Every key stat is visible at a glance, with the ability to drill down by sample size, competition, venue, and even adjust the line threshold to match your bet builder market.
Where to Find Player Profiles
Player Profile pages are accessible throughout the Statz platform. You can reach them by:
- Clicking any player name in fixture projections, team profile pages, or the leaders tables
- Navigating via the search bar at the top of the site (as shown below)
- Using the URL format: statz.ai/player/[player-name]/[player-id]
For example: https://statz.ai/player/cole-palmer/28912747
 Erling Haaland” class=”wp-image-2486″ srcset=”https://blog.statz.ai/wp-content/uploads/2026/01/image-105-1024×153.png 1024w, https://blog.statz.ai/wp-content/uploads/2026/01/image-105-300×45.png 300w, https://blog.statz.ai/wp-content/uploads/2026/01/image-105-768×115.png 768w, https://blog.statz.ai/wp-content/uploads/2026/01/image-105.png 1580w” sizes=”auto, (max-width: 1024px) 100vw, 1024px” />
Understanding the Page Layout
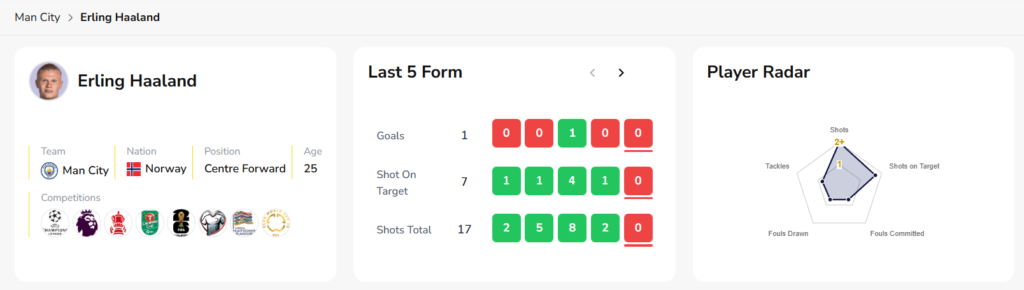
When you land on a Player Profile page, the information is split into three sections across the top of the page. For this guide, we will use Erling Haaland as our example: https://statz.ai/player/erling-haaland/19671.
Left panel – Player bio card: Name, club badge, nationality flag, position, age, and all competitions the player has appeared in this season. Click any competition badge to filter the whole page to that tournament.
Middle panel – Last 5 Form: A game-by-game hit/miss table for the last 5 fixtures showing Goals, Shots on Target, and Shots Total. Green cells mean the player hit the threshold; red means they did not. Use the arrows to scroll further back through recent games.
Right panel – Player Radar: A five-axis radar chart plotting the player’s per-game averages for Shots, Shots on Target, Fouls Committed, Fouls Drawn, and Tackles against the league average. This gives you an instant visual read on the player’s profile – a wide Shots axis tells you a high-volume shooter; a wide Fouls Drawn axis is a foul magnet worth backing in that market.
The Bar Chart and Line Adjuster
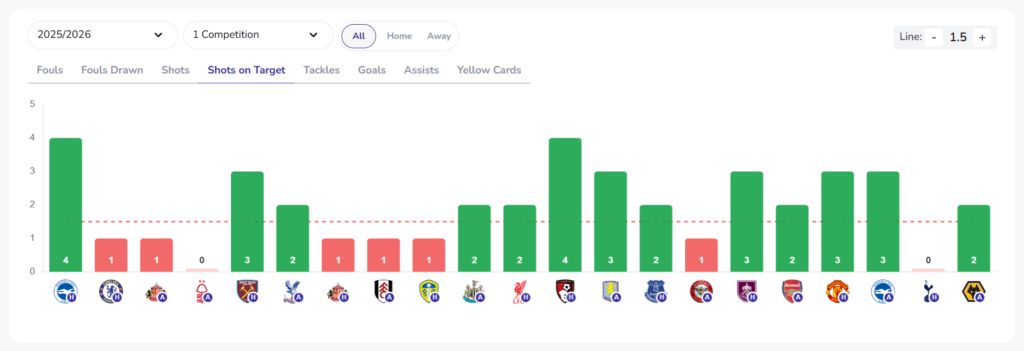
Below the top panels is the bar chart – the most powerful tool on the page for bet builder research. Each bar represents a single fixture. Green bars mean the player exceeded the line; red bars mean they did not.
The stat tabs across the top let you switch between: Fouls, Fouls Drawn, Shots, Shots on Target, Tackles, Goals, Assists, Yellow Cards. Click the one relevant to your market.
The Line adjuster (the – and + buttons next to the Line figure) lets you set the exact threshold you are researching – for example, 0.5, 1.5, or 2.5 shots on target. This directly mirrors the markets you will see on bet builder tools, so you can instantly see the hit rate for that specific line across recent fixtures.
Three filters customise the data further:
Season Dropdown – Switch between the current season and previous seasons. Use the current season for active form; historical seasons to assess long-term consistency.
Competition Dropdown – Filter to a specific competition. Always do this when researching European or cup games – a player’s Champions League output often differs significantly from their domestic numbers.
Home / Away / All Toggle – Many players perform very differently at home versus away. A midfielder with a strong fouls drawn record at home may be far less active in away fixtures. Always check the relevant split before placing a bet.
The Match-by-Match Stat Table
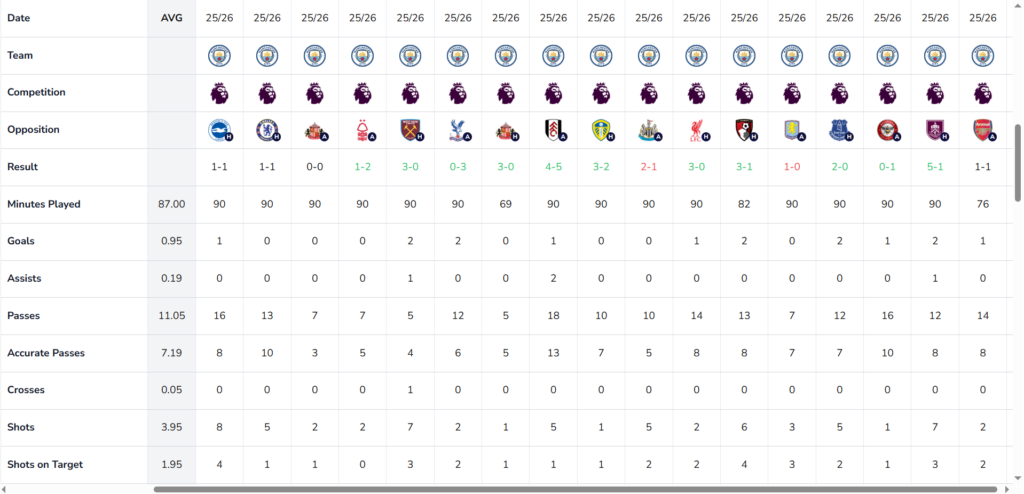
Beneath the bar chart is the full game log table. Each column is a fixture; each row is a stat. The far left AVG column shows the player’s average across the selected sample – this is the number to anchor your analysis to.
Stats tracked in the table include:
- Minutes Played, Goals, Assists
- Shots, Shots on Target
- Fouls Committed, Fouls Drawn
- Passes, Accurate Passes, Crosses
- Tackles, Interceptions, Clearances
- Yellow Cards, Offsides
- Ball Recovery, xG, Opta Points
Scroll right to see more fixtures. Scroll down to see more stats. Results are colour coded: green for wins, red for losses, black for draws – useful context when assessing whether strong stat returns came against weak opposition in comfortable wins.
Putting Player Profile Data Into Action
Example 1: Bet Builder Research
You want to back Cole Palmer 2+ shots on target. Navigate to his player profile, set the Season to current, filter to Premier League, set the Line to 1.5. The bar chart will show you exactly how many of his last 10 league games he hit 2+ SOT – and the Home/Away toggle will tell you whether that changes based on venue. That is your hit rate context before you look at odds.
Example 2: Fouls Drawn Market
You are looking at a fouls drawn bet builder leg. Click the Fouls Drawn tab on the bar chart, set the Line to 0.5, and check the last 10 games. The radar chart at the top will also tell you whether this player over-indexes for fouls drawn versus the league average. If both the radar and the bar chart back the selection, that is a much stronger case than the bar chart alone.
Example 3: FPL Planning
The Opta Points row in the game log shows actual FPL point totals per fixture. Use this alongside the AVG column to assess consistency – a player averaging 18 Opta Points over 10 games is a more reliable differential than one with two 40-point hauls and eight blanks.
Example 4: Cross-Reference With Opponent
Never analyse a player in isolation. Check the opposing team’s profile for goals conceded, defensive stats, and fouls committed alongside the player profile data. The intersection of a player in form against a team with a structural weakness in that stat is where genuine betting value lives.
Understanding the Data Limitations
Player Profile pages are powerful but not complete picture tools on their own. They cannot tell you:
- Whether the player is starting – always check predicted lineups on the H2H page before placing bets
- Injury or suspension status – a player’s stat history is irrelevant if they are not on the pitch
- Tactical context – a new manager or formation change may not yet be reflected in the numbers
- Opponent quality variance – strong stats against weaker sides may not translate against elite opposition
Use Player Profiles alongside the H2H projections page and team profile data for the most complete pre-match picture.
Best Practices
✅ Use the Line adjuster to match the exact bet builder threshold you are considering
✅ Always filter by competition when the next game is a cup or European fixture
✅ Check Home / Away splits before finalising any bet builder leg
✅ Cross-reference with the radar chart – bar chart hit rate plus radar profile is a stronger signal than either alone
✅ Use Last 5-10 games for current form; full season for long-term consistency
❌ Don’t ignore the Last 5 Form panel at the top – it is the quickest red flag check on the page
❌ Don’t assess a player without checking lineup data on the H2H page first
❌ Don’t assume high averages against weaker opposition will repeat against top-half sides
Conclusion
The Statz Player Profile page turns raw match data into actionable betting and fantasy intelligence. Master the Line adjuster, the bar chart tabs, and the Home/Away split, and you will have everything you need to make confident bet builder selections and FPL decisions – all grounded in real match data, not guesswork.
Visit statz.ai/player/[player-name]/[player-id] to explore any player in the Statz database today.
Related Guides
- H2H Page – Always check confirmed lineups here before placing any bet builder leg based on player profile data
- Bet Builder Tool – Take your player profile research and build a same-game multi with live odds
- Player Projections – See the Statz model forecast for any player in upcoming fixtures alongside their historical hit rates
- Fixtures Page – Start here to find today’s games and identify which fixtures have projections ready
Access any player profile at statz.ai/player/[name]/[id]. Find any player via the search bar at the top of statz.ai.