How to use Statz Head-to-Head Page
Welcome to your complete guide for navigating Statz.ai’s Head-to-Head (H2H) match pages. Whether you’re preparing for a fantasy football matchday, analysing betting opportunities, or simply want to dive deep into match statistics, this guide will help you make the most of every feature available.
Overview
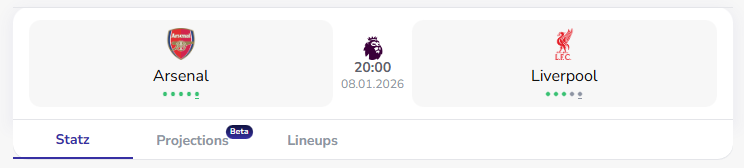
Our H2H pages provide comprehensive pre-match analysis for upcoming fixtures across all major leagues. To find this page, click on a fixture from our home or fixture page, for example, Arsenal vs Liverpool, and you will be sent to the H2H page for that fixture. The top of the page will look like the image below, with each team and their respective last 5 game form (most recent game underlined). Each page is divided into three powerful tabs: Statz, Projections, and Lineups. Let’s explore how to use each one effectively.
Statz Tab
The Statz tab is your historical analysis centre, offering insights into how both team and players have performed recently.
Player Statz
This page shows the 10 players that top each key statistic for each team over recent games. The stats we offer are: Goals, Assists, Shots On Target, Shots Total, Fouls Committed, Fouls Drawn, Yellow Cards and Tackles.
How to Use
- Flick through our stats offering using the icon menu.
- Select a time period (by default shows “Last 10 Games”).
- Choose whether to click the lineup toggle to only show players included in the predicted/confirmed lineup (available near kick off).
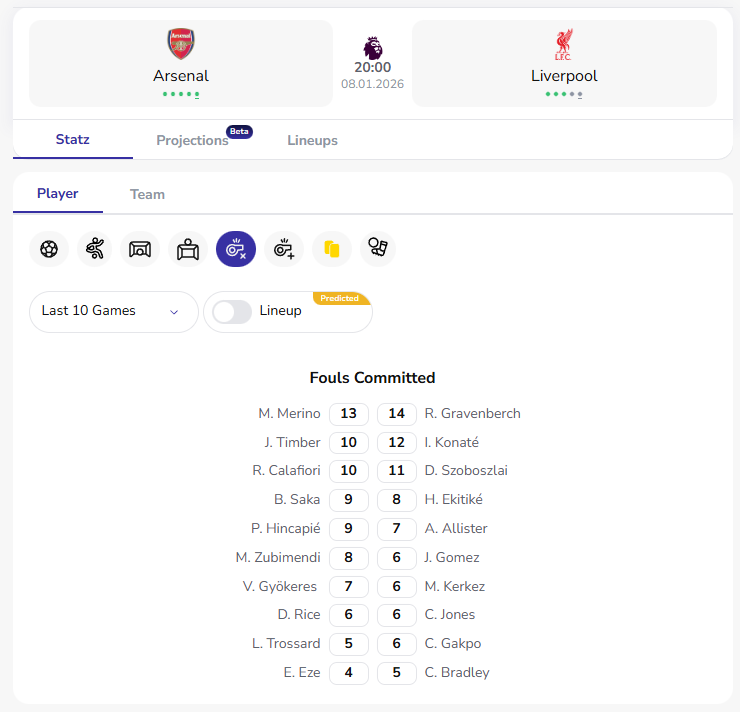
In the example below, the “Fouls Committed” statistic is displayed, showing a head-to-head comparison of players from both teams ranked by their foul counts, with Arsenal players on the left (like M. Merino with 13 fouls) and Liverpool players on the right (like R. Gravenberch with 14 fouls). This granular player-level data helps identify recent player form and who you might want to add to your bet builder.
Team Statz
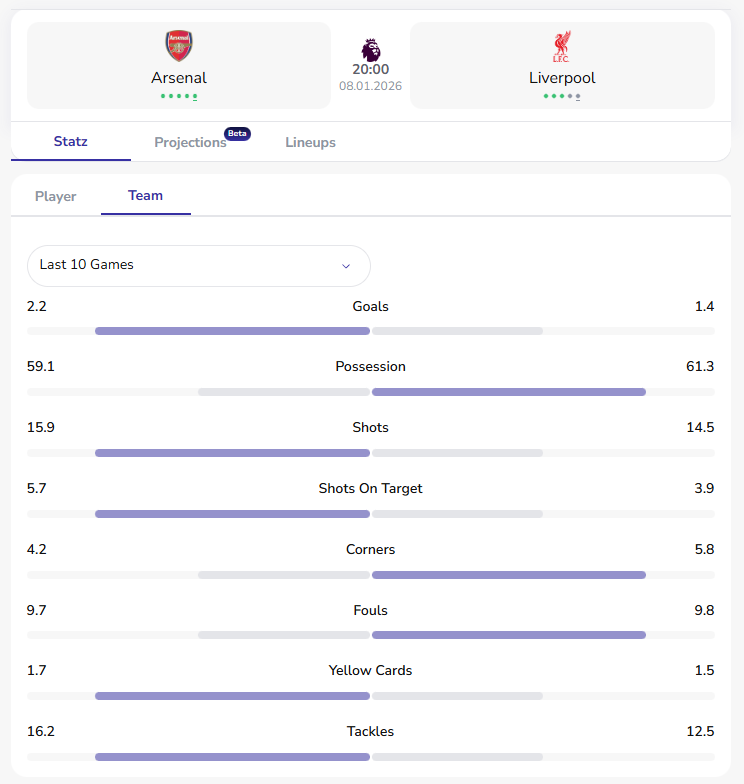
This page shows stat averages for each team over recent games, highlighting the greater amount. Simply, select your time period (default is “Last 10 Games”) and see which team comes out on top for key statistics. The example below, shows a head-to-head comparison of Arsenal and Liverpool, where the home team comes out on top for Goals, Shots and Shots On Target over the last 10 games. This team-level data helps identify recent team form going into the game.
Projections Tab
The Projections tab is where data science meets football. This is your predictive analysis hub, where we use our very own model, combining recent and historical form, to forecast match outcomes and player performances for each upcoming fixture. This tab will usually become available a few days before the fixture. Remember that projections are data-driven forecasts, not guarantees—they should be one tool in your decision-making process alongside your own football knowledge.
Player Projections
This page showcases our top 10 projected players for each key statistic for each team. Again, the stats we offer are: Goals, Assists, Shots On Target, Shots Total, Fouls Committed, Fouls Drawn, Yellow Cards and Tackles.
How to Use
- Flick through our stats offering using the icon menu – Tip: Click the Yellow Card icon and see how our projections are synced up with Bet365 Odds for this statistic.
- Choose whether to click the lineup toggle to only show players included in the predicted/confirmed lineup (available near kick off).
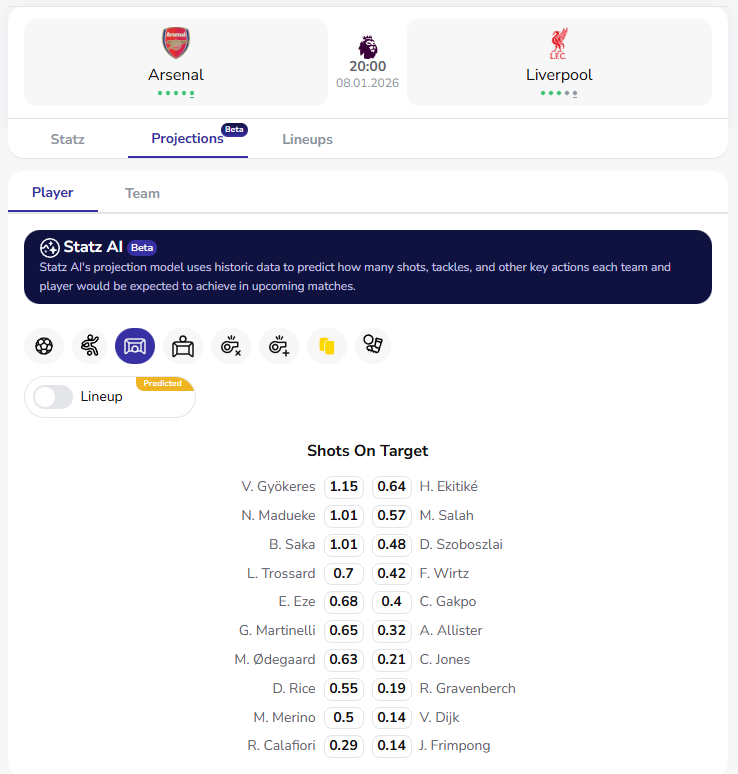
In the example below, the “Shots On Target” statistic is displayed, showing a head-to-head comparison of our player projections from both teams. All of our player-level projections are average expected totals. For example, if the fixture below was played over and over again, the top Arsenal player, V. Gyökeres would be expected to average 1.15 Shots On Target, according to our projection model. Whereas, the top Liverpool player, H. Ekitiké would be expected to average 0.64 Shots On Target.
Team Projections
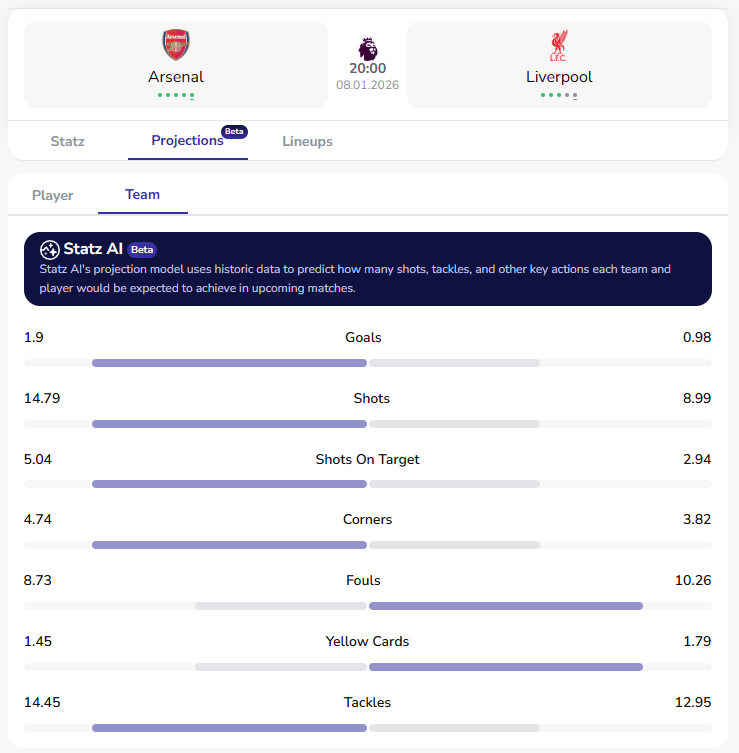
This page shows projected stat averages for each team, highlighting the greater amount. Like player, all of our team-level stat projections are average expected totals. For example, if the fixture below was played over and over again, Arsenal would be expected to score 1.9 goals on average, where as Liverpool just 0.98 goals, our projection model obviously favours the home side.
Lineups Tab
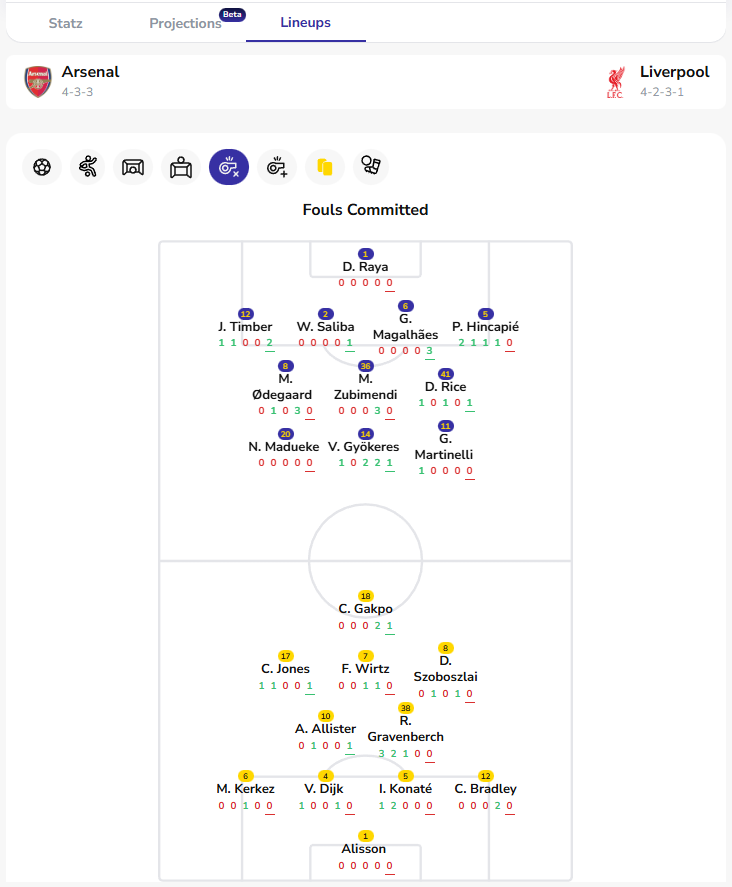
The Lineups tab combines recent stat form with expected/actual starting lineups and formations. Predicted lineups are usually available 1-2 days before kickoff and then the live lineup will be available around an hour before kickoff.
How to Use It
- Check lineups, a player being rested/injured or being used in a different position can change your strategy, e.g. a winger switching to a striker role could impact their output.
- Flick through our stats offering using the icon menu – we cover all the main betting markets.
- Recent form is shown under each player, from left to right, for example, Arsenal‘s striker, V. Gyökeres has been committing fouls for fun recently (5 in his last 3 games) and therefore could be a good one to add to the bet builder.
- Cross-reference form and lineup information with the Projections tab to make more informed decisions.
Putting It All Together
The real power of Statz.ai’s H2H pages comes from using all three tabs together:
- Start with Statz to understand the context and recent form
- Move to Projections to see what the data predicts
- Finish with Lineups to confirm your decisions based on team news
Tips for Best Results
Check Regularly: Team news updates frequently, especially an hour before a match when the confirmed lineup is announced.
Consider Context: Statistics and projections are powerful, but context matters. Cup competitions, local derbies, and end-of-season matches can produce unexpected results.
Use Multiple Data Points: Don’t rely on just one metric. The best decisions come from synthesizing multiple sources of information across all three tabs.
Conclusion
By mastering the Statz, Projections, and Lineups tabs, you’ll have all the information you need to make confident decisions for fantasy football, betting analysis, or simply deepening your understanding of the beautiful game.
Ready to dive deeper? Explore any upcoming fixture on Statz.ai and put this guide into practice. The more you use these tools, the more patterns you’ll recognize and the better your decisions will become.
Related Guides
Once you have analysed your fixture on the H2H page, these guides cover the next steps:
- Player Profile Page – Drill into any player’s match-by-match stats, filter by competition and venue, and set the exact line threshold for your bet builder market
- Bet Builder Tool – Build multi-leg same-game bets from the players you’ve identified, with live odds from bet365, Ladbrokes, Coral, and Midnite
- Fixtures Page – Return to the fixture list to find more games to research
- Fixture Projections – View win/draw/loss and BTTS probabilities across all fixtures for a date
Access any fixture H2H page at statz.ai/fixtures – click any game to open the full analysis suite.