How to use Statz Team Projections
Overview
Our Team Projections page displays advanced metrics that go beyond basic win-loss predictions, offering insights into goals, shots, fouls, cards, and pass statistics. Whether you’re a seasoned bettor looking for an edge or a casual fan wanting to understand match dynamics better, Statz transforms complex data into actionable intelligence.
Where to Find Team Projections
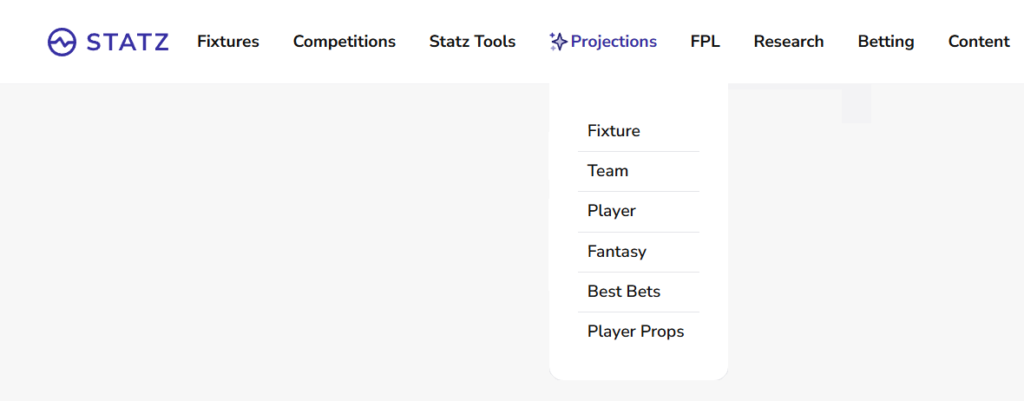
From our homepage, click the “Projections” tab in the top menu bar and you will find “Fixture” as shown in the image below.
How to Use
Navigating and Understanding the Table
When you first visit the Statz Team Projections page, you’ll see a clean, tabular interface with several columns. The league selector in the top-right corner allows you to switch between different competitions, with the Premier League as the default option.
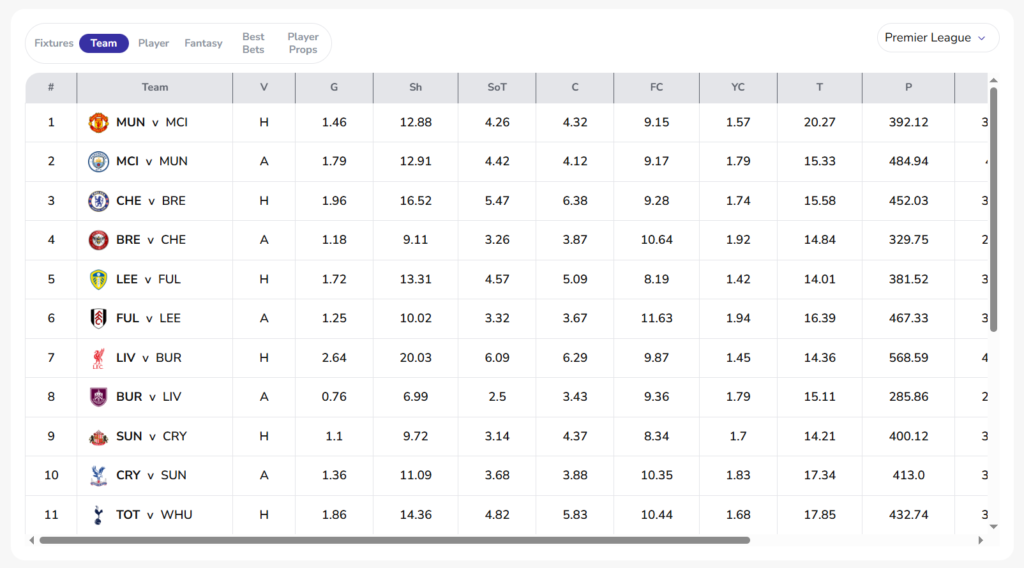
Each row represents a single match from one team’s perspective and each column represents a statistic. With a full game week of projections, like in the image above, to explore the full table you will need to scroll across to see all statistics and scroll down to see all teams. Each stat column is sortable and has also been shortened to condense the table, here’s what they stand for:
- V = Venue
- G = Goals
- Sh = Shots
- SoT = Shots on Target
- C = Corners
- FC = Fouls Committed
- YC = Yellow Cards
- T = Tackles
- P = Passes
- AP = Accurate Passes
- Cr = Crosses
- I = Interceptions
- O = Offsides
Reading the Projections
The data is presented as decimal numbers representing average expected totals, calculated by comparing team and opponent weighted averages for each statistic over their last 30 games. For example a shot projection of 10.5 means that if a fixture was played over and over again, 10.5 is the average number of shots our model would expect that team to have.
Tip: Notice that each fixture appears twice in the table—once from each team’s perspective. This allows you to see both sides of the matchup and compare projections directly.
Putting Projections Into Action
Example 1: Total Market Betting Opportunities
A total betting market (also called “over/under”) is a type of bet on the combined number of goals/shots/corners etc from both teams in a football match. The bookmaker will set a line, like 2.5 goals, and you can then bet on whether the actual total will be over or under. The “.5” is used to avoid ties – there can’t be half a goal, so there’s always a clear winner.
Chelsea (CHE) and Brentford (BRE) in row 3 and 4 shows:
- Chelsea corners: 6.38
- Brentford corners: 3.87
Combined, this match projects 10.25 (6.38+3.87) total corners, which can help you evaluate the total corner market by comparing to their chosen line for the fixture.
Example 2: Identifying High-Scoring Matches
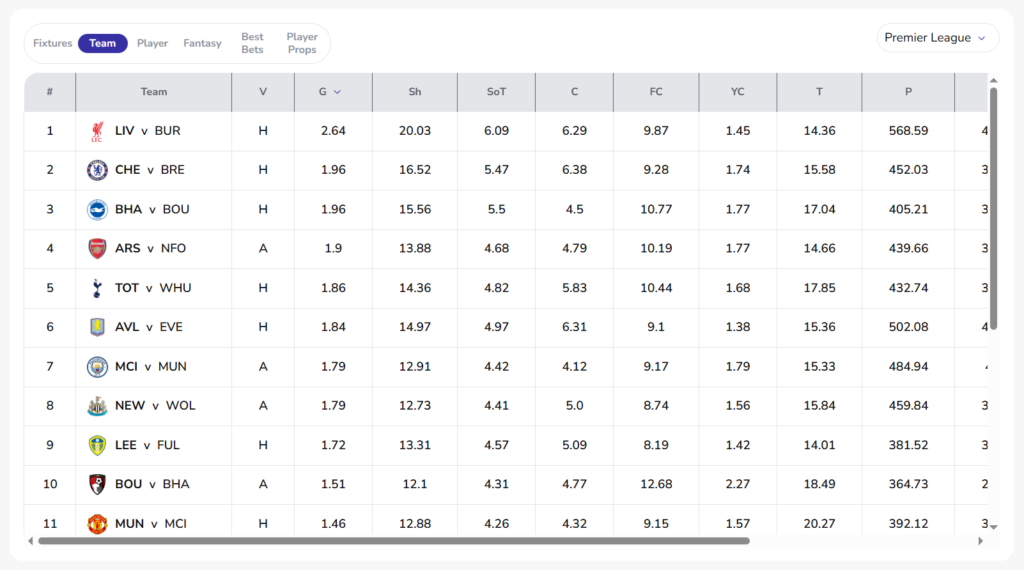
Sort by the Goals column to see which teams are projected to score the most goals. Looking at the top row (image below), Liverpool (LIV) vs Burnley (BUR) shows some interesting numbers:
- Liverpool projected goals: 2.64
- Liverpool projected shots: 20.03
- Liverpool projected shots on target: 6.09
This suggests Liverpool is expected to dominate offensively at home. Compared to Burnley’s projection, which is just 0.76 projected goals, you can identify this as a potentially one-sided match. This information could be valuable for over/under goal bets or correct score predictions.
Example 3: Cards and Discipline Analysis
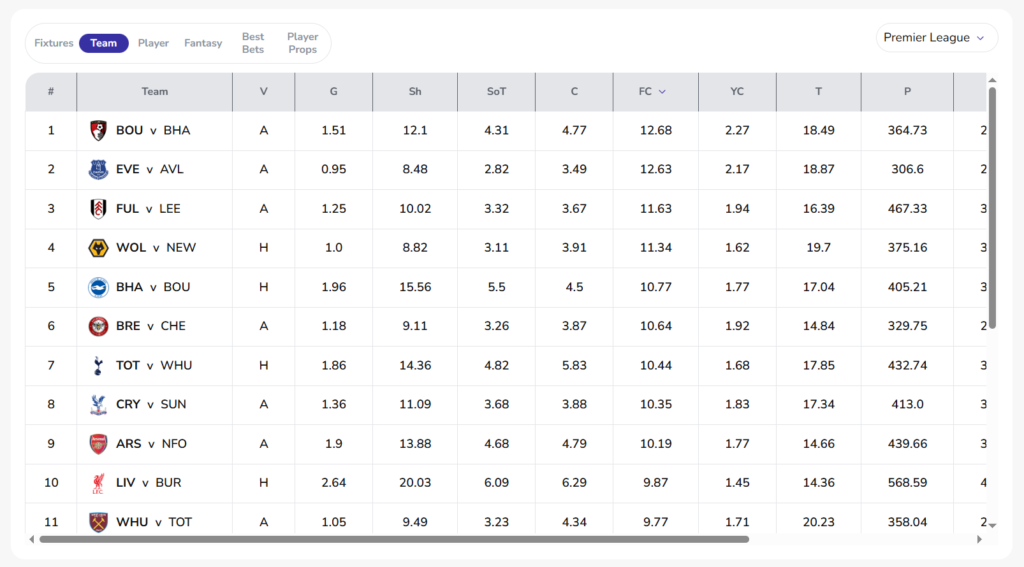
For those interested in fouls/bookings markets, sort by columns FC or YC to assess which matches/teams are projected to rack up the most fouls/cards, for example:
- Bournemouth (BOU) in row 1: 12.68 fouls, 2.27 yellow cards
- Brighton (BHA) in row 5: 10.77 fouls committed, 1.77 yellow cards
With these teams playing each other and both being in the top 5 foul projections, this suggests a physical affair and therefore foul and card bets in this fixture might offer more value.
Conclusion
By consolidating multiple statistical projections into one easy-to-read interface, the Statz Team Projections page saves hours of manual research and provides data-backed insights that can improve your decision-making.
Remember that projections are probabilities, not certainties. Use them as one component of your broader research strategy, combining them with team news, head-to-head history, and your own knowledge of the sport.
Visit statz.ai/projections/team today to start exploring the data and finding your edge in sports betting.