How to use Statz Fixture Projections
Overview
Understanding match probabilities can give you a significant edge when analysing football fixtures. Whether you’re building betting strategies, managing fantasy football teams, or simply want deeper insights into upcoming matches, learning to interpret fixture projections is essential. This guide will walk you through how to maximize value from our fixture projection page, covering match result probabilities, predicted goals, and goal-based betting markets, synced with bet365 odds.
What Are Fixture Projections?
Our fixture projections use statistical models and historical data to calculate the probability of different outcomes in football matches. These projections analyse team performance, home/away records, recent form, and other factors to generate accurate forecasts for upcoming games.
Where to Find Fixture Projections
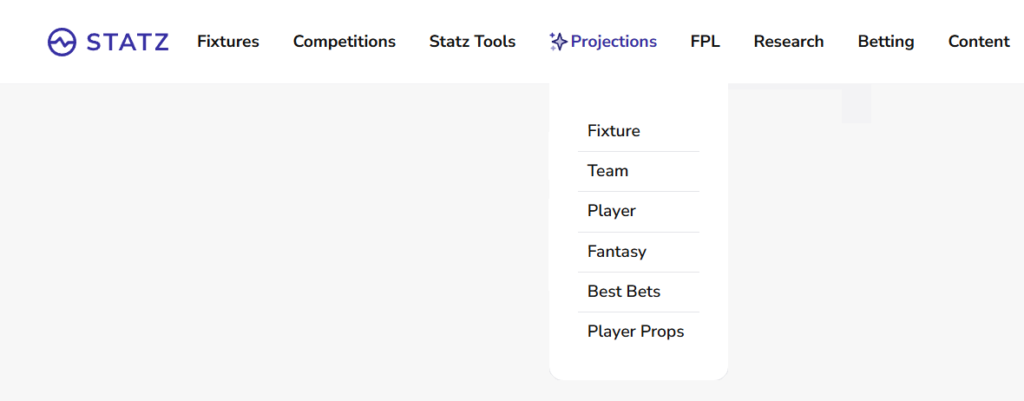
From our homepage, click the “Projections” tab in the top menu bar and you will find “Fixture” as shown in the image below.
How to Use
Our fixture projection page offers three distinct views of match data synced with bet365 odds. Let’s explore each one and how to use them effectively.
1. Result – Match Outcome Probabilities
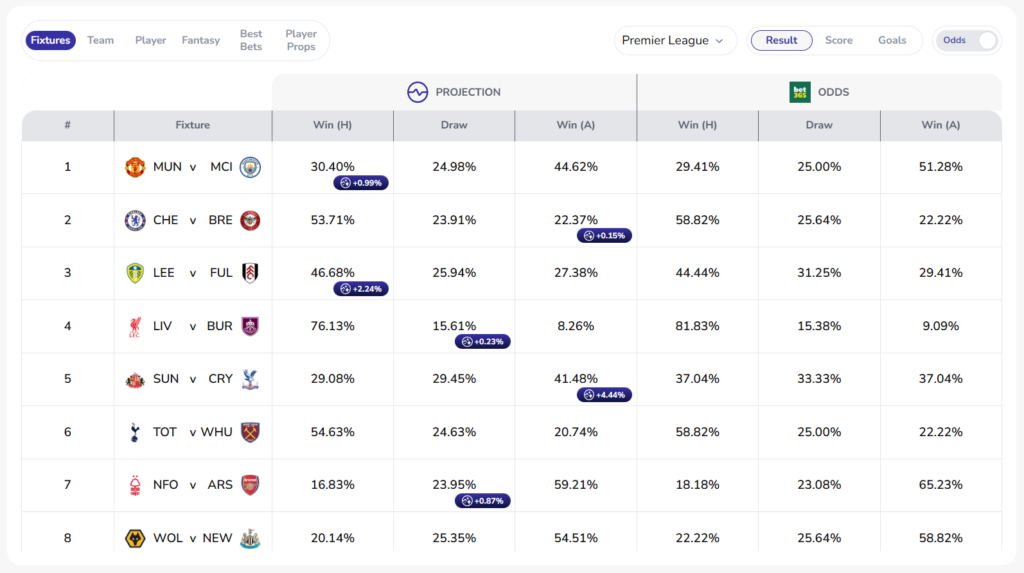
Result is the default tab that you will land on and the Premier League will be selected, however, using the dropdown, different leagues can be selected. As shown below the results table is split into two parts: Our Result Projections and Bet365 Odds. Each side displays the three possible match outcomes: home win, draw, and away win. The bet365 percent probabilities are implied from their odds, for example odds of 2.0 (or 1/1) imply 50% likelihood.
Finding Value (Edge)
When analysing the table, search for the purple Statz Edge indicators. These are highlighting where our projections suggest potential value compared to the bet365 odds.
Example: Sunderland vs Crystal Palace
In this fixture, our projection model has Crystal Palace (away win) at 41.48% likely where as the bet365 has them at just 37.04%. Therefore, our model suggests an edge of +4.44%, in other words, it thinks Palace are 4.44% more likely to win than bet365, suggesting value in an away win bet. This is where the real value of this page lies!
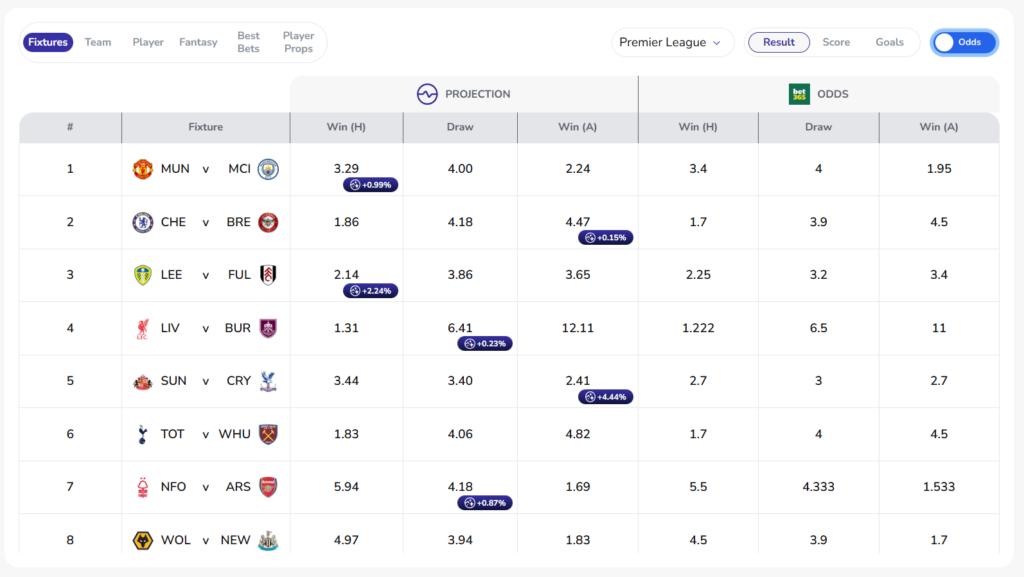
Tip: If you are more used to seeing odds instead of percentages, click the odds toggle to switch to Odds view, as shown below. Projected odds are what our model thinks the odds should be implied by our projected outcomes.
2. Score – Team Goal Projections
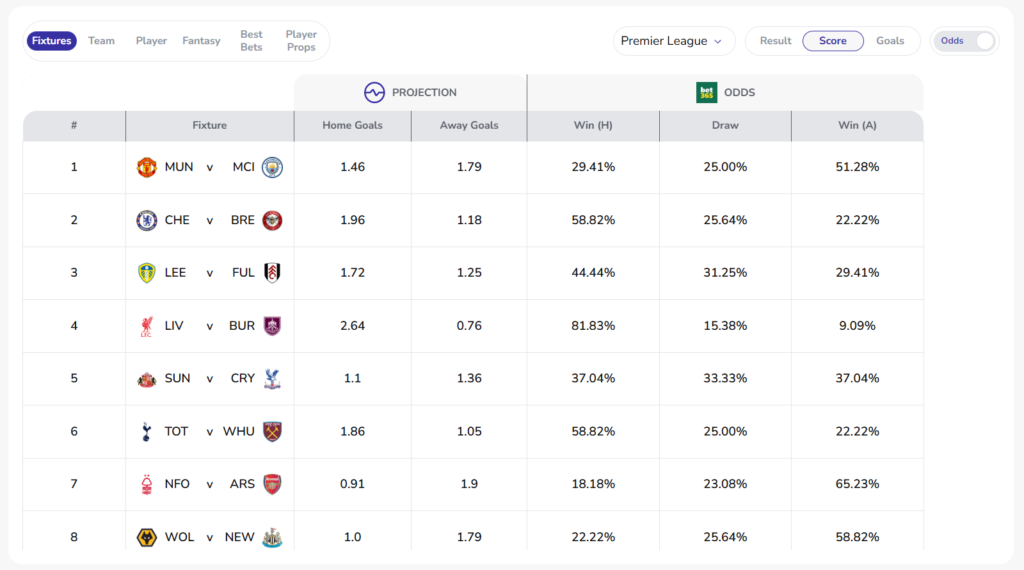
The Score tab, accompanies the previous tab by providing average goal projections for both teams, giving you an insight into the predicted score line. Average goal projections help you understand not just who might win, but how the match is likely to unfold.
In the image below, we can see that Liverpool are projected to score 2.64 goals. This means, according to our model, if the fixture was played over and over again, on average, Liverpool would score 2.64 goals. Strugglers, Burnley, on the other hand, are projected to score just 0.76 goals, suggesting a dominant home performance with multiple scoring opportunities.
Tip: Use score projections to:
- Identify high-scoring vs low-scoring matches
- Compare offensive and defensive strengths
- Make informed decisions on fantasy football captaincy and differentials
3. Goals – Total Fixture Goal Probabilities
This tab is invaluable for goal-based betting strategies and understanding match competitiveness. Like Result, the Goals tab is split into Statz Projections and Bet365 Odds focusing solely on the following popular betting markets:
- Total Goals (Over 1.5/2.5 Goals) – The likelihood of the match producing over X amount of goals.
- Both Teams to Score – The likelihood of both the home and away team scoring in the match.
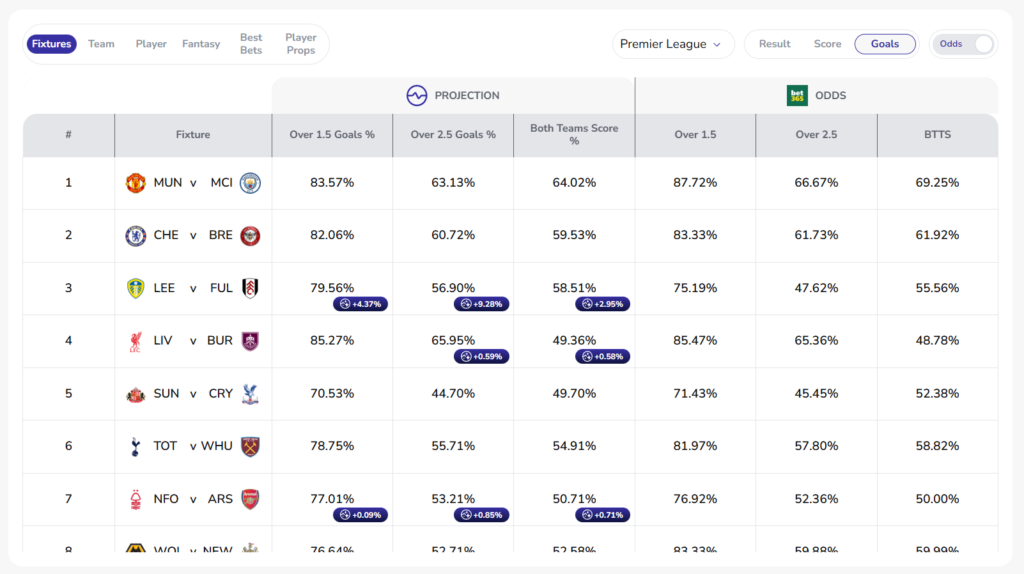
Example: Leeds United vs Fulham
For the Leeds vs Fulham fixture our projections are showing 79.56% for over 1.5 goals, 56.90% for over 2.5 goals, and 58.51% BTTS. All of these selections show positive value (edge) suggesting our projections expect a more attacking match than Bet365.
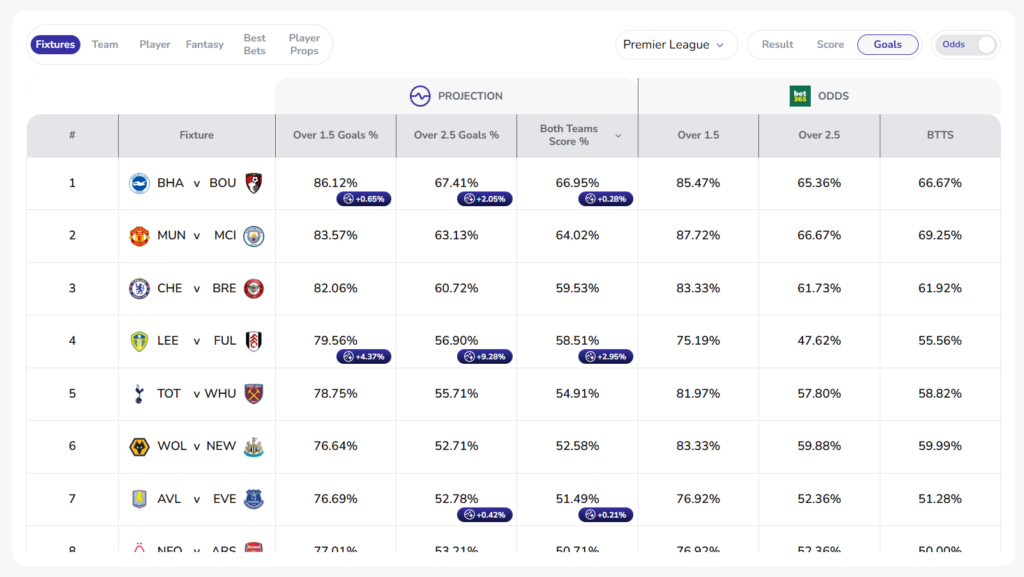
Tip: Click on the top of the Both Teams Score % column to sort and see which fixtures are most likely to have both teams score. For example below, Brighton vs Bournemouth is top for BTTS % with 66.95%.
Combining All Three Tabs for Maximum Insight
The real power comes from analyzing all three tabs together:
- Start with the Result tab to understand the match outcome probabilities
- Check the Score tab to see expected goal totals and match intensity
- Review the Goals tab to identify specific goal market opportunities
Example: Chelsea vs Brentford:
- Result: Chelsea 53.7% win probability
- Score: Chelsea 1.96 vs 1.18 Brentford
- Goals: 82.1% over 1.5 goals, 59.5% BTTS
This tells you Chelsea is favoured but not overwhelmingly, both teams likely to score, and the match should produce at least two goals total.
Conclusion
Mastering fixture projections requires understanding how to interpret result probabilities, predicted goals, and goal market forecasts. By analysing all three tabs and comparing projections with market odds, you can make more informed decisions and identify value opportunities that others might miss. Start by familiarizing yourself with each tab’s metrics, then practice combining insights across all three views to build a comprehensive understanding of each fixture. Check out the fixture projections page here!