



























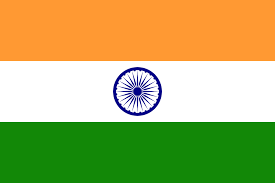
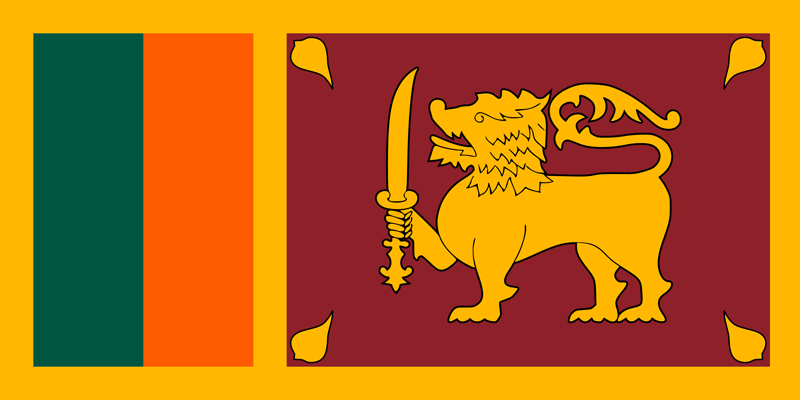
The Chinnaswamy Stadium pitch report shows a ground built for runs: the first innings has averaged 287.3 in the last 6 completed ODIs, 190.4 in the last 30 T20s and the T20 match total 373.6 runs. Pace bowlers take 66% of the wickets in both white-ball formats. India meet Sri Lanka in an ODI in Bengaluru on 16 December 2026, so this guide sets out what the ground has produced in ODIs, T20s and Tests.
Every figure comes from the M. Chinnaswamy Stadium ground page and its ODI, T20 and Test pitch reports, which update after each match. Rain-affected games are left out of the averages, as they are on those pages. Our records hold 86 completed matches at the ground.
What is the average ODI score at Chinnaswamy Stadium?
The average first-innings ODI score at Chinnaswamy Stadium is 287.3 runs, from the last 6 completed ODIs since September 2017. Chasing sides averaged 248.2 and the match total averaged 535.5 runs, with 15.5 sixes and 50.2 fours a match. Boundaries made up 54.8% of the runs, and the highest first-innings total is 410.
The 7 ODIs in our records, newest first (the 2023 New Zealand v Pakistan game was decided on DLS and sits outside the averages):
| Date | Batting first | Score | Chasing | Score | Result |
|---|---|---|---|---|---|
| 12 Nov 2023 | India | 410 | Netherlands | 250 | India won by 160 runs |
| 9 Nov 2023 | Sri Lanka | 171 | New Zealand | 172 | New Zealand won by 5 wickets |
| 4 Nov 2023 | New Zealand | 401 | Pakistan | 200 | Pakistan won by 21 runs (DLS) |
| 26 Oct 2023 | England | 156 | Sri Lanka | 160 | Sri Lanka won by 8 wickets |
| 20 Oct 2023 | Australia | 367 | Pakistan | 305 | Australia won by 62 runs |
| 19 Jan 2020 | Australia | 286 | India | 289 | India won by 7 wickets |
| 28 Sep 2017 | Australia | 334 | India | 313 | Australia won by 21 runs |
Five of the 7 came at the 2023 World Cup, and 3 of those first innings passed 360. The other 2 collapsed below 175, so the range at the ground is wide: 156 is the lowest first-innings total in the run, 254 runs short of the highest.
Is it better to bat first or chase at Chinnaswamy Stadium?
Chasing edges it at Chinnaswamy Stadium: sides batting second won 53% of the last 30 T20s and 50% of the last 6 completed ODIs. Across all 7 ODIs in our records the chasing side won 4. In T20s, captains who won the toss chose to bowl in 27 of 29 matches.
The toss winner went on to win 15 of the 27 T20s with a result there, or 56%. In ODIs the choice is more even: captains chose to bat first in 4 of 7 and to bowl in 3, and the toss winner won 4 of the 7. The DLS method decided 1 of the 7 ODIs, when Pakistan beat New Zealand's 401 in a rain-shortened chase.
What is the average IPL score at Chinnaswamy Stadium?
The average IPL first-innings score at Chinnaswamy Stadium is 193.7 runs, across the 24 completed IPL games since 2019 in our match list. The side batting first passed 200 in 10 of the 24, chasing sides won 13, and the games averaged 20.3 sixes. Royal Challengers Bengaluru won 14 of the 24.
RCB won 4 of their 5 home games in IPL 2026. The 9 completed IPL games at the ground in 2025 and 2026, newest first:
| Date | Batting first | Score | Chasing | Score | Result |
|---|---|---|---|---|---|
| 24 Apr 2026 | Gujarat Titans | 205 | RCB | 206 | RCB won by 5 wickets |
| 18 Apr 2026 | RCB | 175 | Delhi Capitals | 179 | Delhi Capitals won by 6 wickets |
| 15 Apr 2026 | Lucknow Super Giants | 146 | RCB | 149 | RCB won by 5 wickets |
| 5 Apr 2026 | RCB | 250 | Chennai Super Kings | 207 | RCB won by 43 runs |
| 28 Mar 2026 | Sunrisers Hyderabad | 201 | RCB | 203 | RCB won by 6 wickets |
| 3 May 2025 | RCB | 213 | Chennai Super Kings | 211 | RCB won by 2 runs |
| 24 Apr 2025 | RCB | 205 | Rajasthan Royals | 194 | RCB won by 11 runs |
| 10 Apr 2025 | RCB | 163 | Delhi Capitals | 169 | Delhi Capitals won by 6 wickets |
| 2 Apr 2025 | RCB | 169 | Gujarat Titans | 170 | Gujarat Titans won by 8 wickets |
The highest total at the ground is 287, by Sunrisers Hyderabad against RCB on 15 April 2024. RCB replied with 262 and the match produced 38 sixes, the most in any game in the list. The lowest first innings in the last 30 T20s is 134.
Is Chinnaswamy Stadium a pace or spin pitch?
Chinnaswamy Stadium favours pace for wickets: seamers take 66% of them in T20s and ODIs, against 27% and 28% for spin. Spinners are cheaper, though, conceding 8.88 an over in T20s to 9.97 for pace, and 5.69 in ODIs to 6.40. In Tests the split is even at 49% each.
| Format | Matches read | Avg 1st inns | Avg 2nd inns | Pace wkts | Spin wkts | Pace econ | Spin econ |
|---|---|---|---|---|---|---|---|
| T20 | 30 since 2019 | 190.4 | 183.2 | 66% | 27% | 9.97 | 8.88 |
| ODI | 6 since 2017 | 287.3 | 248.2 | 66% | 28% | 6.40 | 5.69 |
| Test | 2 since 2022 | 149.0 | 255.5 | 49% | 49% | 3.34 | 4.34 |
Boundaries make up 63.4% of T20 runs at the ground and 54.8% of ODI runs, against 56.9% in Tests. For how surfaces like this one compare with slower Indian pitches, see every type of cricket pitch explained.
What is the average Test score at Chinnaswamy Stadium?
The average first-innings Test score at Chinnaswamy Stadium is 149.0 runs, from the last 2 completed Tests since March 2022. The second innings averaged 255.5 and the match total 946.0 runs. That low first-innings figure comes from India's 46 all out against New Zealand in October 2024.
New Zealand made 402 in reply, India fought back with 462, and New Zealand reached 110 for 2 to win by 8 wickets (the scorecard). In March 2022 India beat Sri Lanka by 238 runs after making 252 and 303. Both Tests counted in the World Test Championship.
How have India and Sri Lanka done at Chinnaswamy in ODIs?
India have won 2 of their 3 ODIs at Chinnaswamy Stadium and average 337 there, while Sri Lanka have won 1 of 2 and average 166. Rohit Sharma has 245 ODI runs at the ground and Mohammed Shami 4 wickets.
For Sri Lanka, Pathum Nissanka has 79 ODI runs at the ground and Angelo Mathews 4 wickets. India's 3 ODIs here are the 410 against the Netherlands, the 289 chase against Australia in 2020 and the 21-run loss to Australia in 2017. Rohit's 2026 form is in Rohit Sharma ODI runs in 2026, and this year's leaders are on the ODI runs board and the ODI wickets board.
Where to follow the Chinnaswamy numbers
The Chinnaswamy ODI pitch report adds India v Sri Lanka after 16 December, and the T20 pitch report moves with every IPL game. Our ODI hub carries the series, and the Dream11 page lists the match teams nearer the day.
For other venues, the grounds index holds a pitch report for every ground, and we have written the same guide for Adelaide Oval and the Gaddafi Stadium. The IPL winners list covers every season, including RCB's.
More Test numbers
More from Statz
- New Zealand lose Santner with a 55% Test win record
- New Zealand lose Santner with his 9 ODI wickets this year
- Power Surge BBL Rules Explained: How a Big Bash Game Works
- DLS Method Explained: How Rain Targets Are Set in Cricket
- Joe Root makes history as England beat Australia by 135
- BBL Winners List: Every Big Bash Champion Since 2011-12