



























Indian Premier League 2017
 India
Indian Premier League Player Dot Ball Percentage 2017
Every player ranked on dot ball percentages. Sorted on at least 10 overs.
Updated 21 May 2017, after Rising Pune Supergiants vs Mumbai Indians
| #Player | M | Overs | Wkts | Econ | Avg | SR | Dots | Dot % | Mdns | Best |
|---|---|---|---|---|---|---|---|---|---|---|
1
  Mohammad Nabi All-rounder |
3 | 11 | 2 | 5.27 | 29.00 | 33.0 | 35 | 53.0% | 0 | 1 |
2
  Lockie Ferguson Bowler |
4 | 14.3 | 3 | 6.41 | 31.00 | 29.0 | 43 | 49.4% | 0 | 2 |
3
 Washington Sundar All-rounder |
10 | 30.2 | 8 | 6.10 | 23.13 | 22.8 | 85 | 46.7% | 0 | 3 |
4
  Mitchell Johnson Bowler |
5 | 20.5 | 7 | 6.77 | 20.14 | 17.9 | 58 | 46.4% | 1 | 3 |
5
 Jaydev Unadkat Bowler |
12 | 46.3 | 24 | 6.92 | 13.42 | 11.6 | 126 | 45.2% | 3 | 5 |
6
  Shahbaz Nadeem Bowler |
7 | 18.2 | 6 | 6.49 | 19.83 | 18.3 | 47 | 42.7% | 0 | 2 |
7
  Varun Aaron Bowler |
6 | 21.3 | 7 | 7.58 | 23.29 | 18.4 | 55 | 42.6% | 0 | 2 |
8
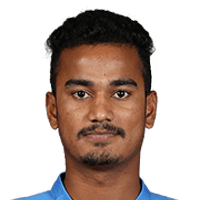  Pawan Negi Bowler |
12 | 33.2 | 16 | 5.91 | 12.31 | 12.5 | 85 | 42.5% | 0 | 3 |
9
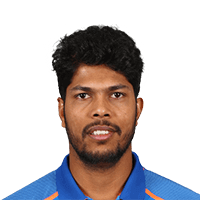  Umesh Yadav Bowler |
14 | 50.4 | 17 | 8.09 | 24.12 | 17.9 | 129 | 42.4% | 0 | 4 |
10
 Samuel Badree Batter |
7 | 25.1 | 9 | 7.47 | 20.89 | 16.8 | 64 | 42.4% | 1 | 4 |
11
 Ben Stokes All-rounder |
12 | 45.4 | 12 | 6.92 | 26.33 | 22.8 | 116 | 42.3% | 1 | 3 |
12
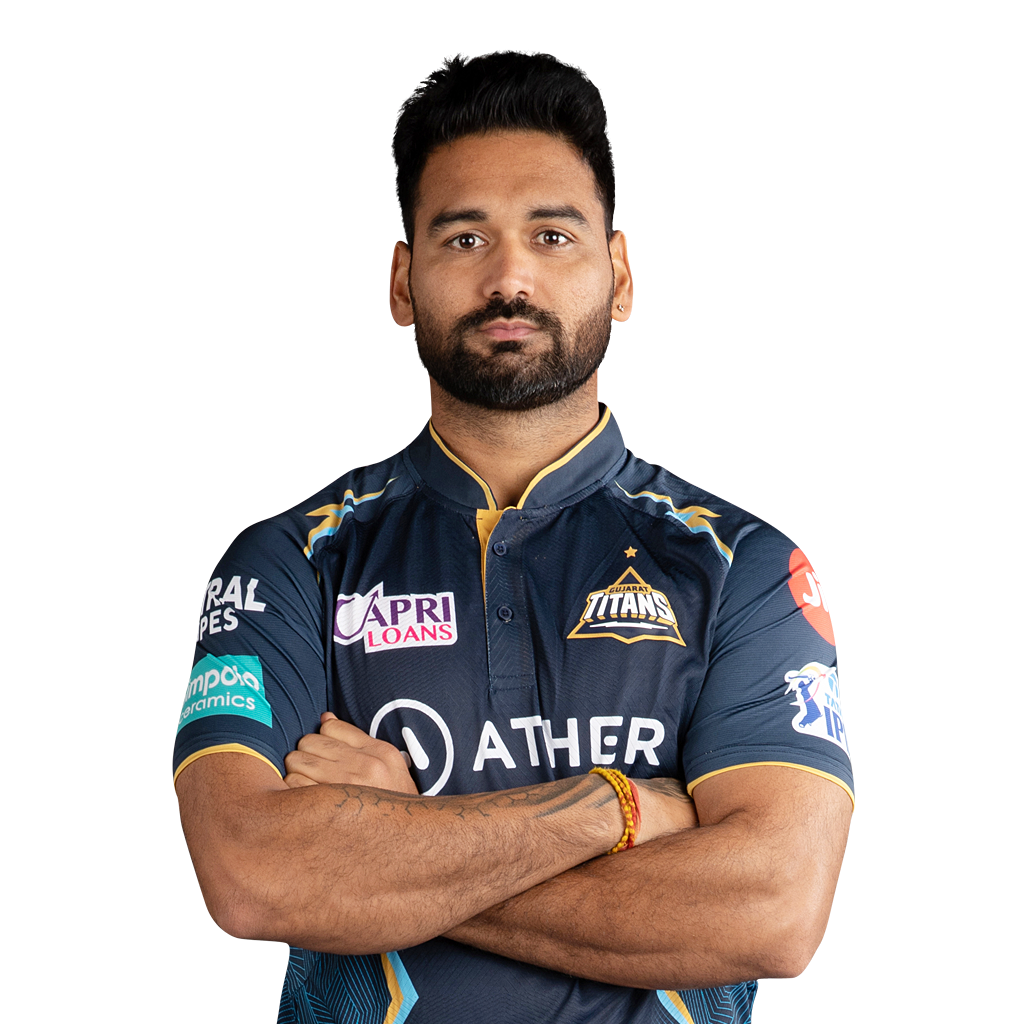  Pradeep Sangwan Bowler |
5 | 18.2 | 5 | 9.87 | 36.20 | 22.0 | 46 | 41.8% | 0 | 2 |
13
 Nathan Coulter-Nile All-rounder |
8 | 29.4 | 15 | 7.69 | 15.20 | 11.9 | 74 | 41.6% | 0 | 3 |
14
 Karn Sharma Bowler |
9 | 31.3 | 13 | 6.79 | 16.46 | 14.5 | 78 | 41.3% | 0 | 4 |
15
 Tymal Mills Bowler |
5 | 18.3 | 5 | 8.27 | 30.60 | 22.2 | 45 | 40.5% | 0 | 2 |
16
 Bhuvneshwar Kumar Bowler |
14 | 54 | 26 | 6.83 | 14.19 | 12.5 | 131 | 40.4% | 0 | 5 |
17
 Harbhajan Singh Bowler |
11 | 41.1 | 8 | 6.46 | 33.25 | 30.9 | 98 | 39.7% | 0 | 3 |
18
 Sandeep Sharma Bowler |
13 | 50 | 17 | 7.96 | 23.41 | 17.6 | 119 | 39.7% | 0 | 4 |
19
 Rashid Khan Bowler |
14 | 54.4 | 17 | 6.55 | 21.06 | 19.3 | 129 | 39.3% | 0 | 3 |
20
 Trent Boult Bowler |
6 | 24.4 | 5 | 8.76 | 43.20 | 29.6 | 58 | 39.2% | 0 | 2 |
21
 Praveen Kumar Bowler |
6 | 18 | 6 | 8.39 | 25.17 | 18.0 | 42 | 38.9% | 0 | 2 |
22
 Aniket Choudhary Bowler |
5 | 18 | 5 | 8.00 | 28.80 | 21.6 | 42 | 38.9% | 2 | 2 |
23
 Andrew Tye Bowler |
6 | 21.2 | 12 | 6.61 | 11.75 | 10.7 | 49 | 38.3% | 0 | 5 |
24
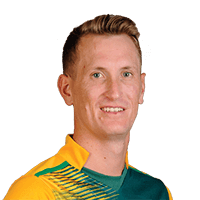 Chris Morris All-rounder |
9 | 31.3 | 12 | 7.62 | 20.00 | 15.8 | 72 | 38.1% | 0 | 4 |
25
 Kagiso Rabada Bowler |
6 | 22.5 | 6 | 8.23 | 31.33 | 22.8 | 52 | 38.0% | 0 | 2 |
26
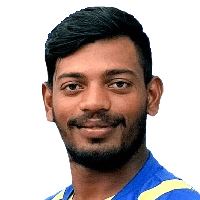 Ankit Rajpoot Bowler |
5 | 14.3 | 4 | 7.38 | 26.75 | 21.8 | 33 | 37.9% | 0 | 3 |
27
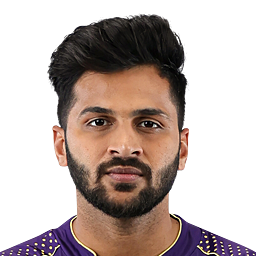 Shardul Thakur Bowler |
12 | 39.5 | 11 | 7.91 | 28.64 | 21.7 | 89 | 37.2% | 0 | 3 |
28
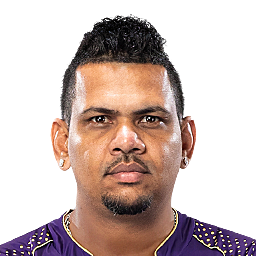 Sunil Narine Bowler |
16 | 60.2 | 10 | 6.83 | 41.20 | 36.2 | 133 | 36.7% | 0 | 2 |
29
 Yuzvendra Chahal Bowler |
13 | 45.1 | 14 | 7.37 | 23.79 | 19.4 | 99 | 36.5% | 0 | 3 |
30
 Ashish Nehra Bowler |
6 | 22 | 8 | 8.95 | 24.63 | 16.5 | 48 | 36.4% | 0 | 3 |
31
 Mitchell McClenaghan Bowler |
14 | 57.3 | 19 | 8.82 | 26.68 | 18.2 | 124 | 35.9% | 0 | 3 |
32
 Jasprit Bumrah Bowler |
16 | 60.5 | 20 | 7.23 | 22.00 | 18.3 | 130 | 35.6% | 1 | 3 |
33
 Mohammed Siraj Bowler |
6 | 23.3 | 10 | 9.02 | 21.20 | 14.1 | 50 | 35.5% | 0 | 4 |
34
 Ashok Dinda Bowler |
3 | 10.5 | 1 | 10.98 | 119.00 | 65.0 | 23 | 35.4% | 0 | 1 |
35
 Mohammed Shami Bowler |
8 | 27.3 | 5 | 8.84 | 48.60 | 33.0 | 57 | 34.5% | 0 | 2 |
36
 Ishant Sharma Bowler |
6 | 19 | 0 | 9.42 | - | - | 39 | 34.2% | 0 | 0 |
37
 Ankit Soni Bowler |
6 | 18.4 | 2 | 7.71 | 72.00 | 56.0 | 38 | 33.9% | 0 | 1 |
38
 Glenn Maxwell All-rounder |
14 | 19.1 | 7 | 6.52 | 17.86 | 16.4 | 39 | 33.9% | 0 | 2 |
39
 Pat Cummins Bowler |
12 | 48.1 | 15 | 7.74 | 24.87 | 19.3 | 98 | 33.9% | 0 | 2 |
40
 Lasith Malinga Bowler |
12 | 47.5 | 11 | 7.97 | 34.64 | 26.1 | 97 | 33.8% | 0 | 2 |
41
 Amit Mishra Bowler |
14 | 39.3 | 10 | 8.68 | 34.30 | 23.7 | 80 | 33.8% | 0 | 3 |
42
 Chris Woakes All-rounder |
13 | 46.2 | 17 | 8.33 | 22.71 | 16.4 | 93 | 33.5% | 0 | 3 |
43
 Colin de Grandhomme All-rounder |
12 | 17 | 4 | 7.94 | 33.75 | 25.5 | 34 | 33.3% | 0 | 3 |
44
 Tim Southee Bowler |
3 | 11 | 3 | 8.73 | 32.00 | 22.0 | 22 | 33.3% | 1 | 2 |
45
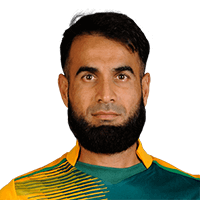 Imran Tahir Bowler |
12 | 47.4 | 18 | 7.74 | 20.50 | 15.9 | 95 | 33.2% | 0 | 3 |
46
 Adam Milne Bowler |
4 | 15 | 3 | 8.93 | 44.67 | 30.0 | 29 | 32.2% | 0 | 2 |
47
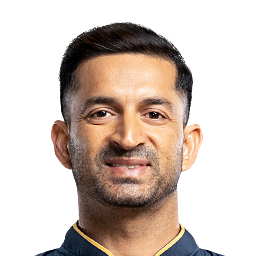 Mohit Sharma Bowler |
14 | 46.1 | 13 | 8.88 | 31.54 | 21.3 | 89 | 32.1% | 0 | 2 |
48
 Zaheer Khan Bowler |
11 | 41 | 10 | 7.63 | 31.30 | 24.6 | 79 | 32.1% | 0 | 3 |
49
 Sreenath Aravind Bowler |
10 | 31.4 | 5 | 8.68 | 55.00 | 38.0 | 61 | 32.1% | 0 | 2 |
50
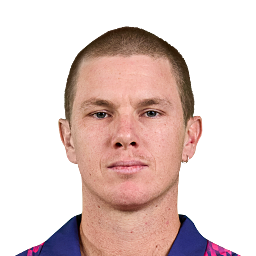 Adam Zampa Bowler |
6 | 20.2 | 7 | 8.02 | 23.29 | 17.4 | 39 | 32.0% | 0 | 2 |
51
 Daniel Christian All-rounder |
13 | 41.3 | 11 | 7.18 | 27.09 | 22.6 | 79 | 31.7% | 0 | 2 |
52
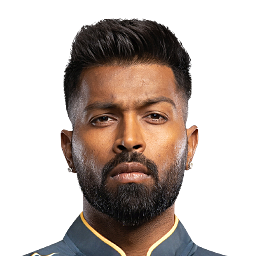 Hardik Pandya All-rounder |
17 | 27 | 6 | 7.89 | 35.50 | 27.0 | 51 | 31.5% | 0 | 2 |
53
 Krunal Pandya All-rounder |
13 | 41 | 10 | 6.66 | 27.30 | 24.6 | 77 | 31.3% | 0 | 3 |
54
 Shivil Koushik Bowler |
3 | 11.2 | 0 | 9.26 | - | - | 21 | 30.9% | 0 | 0 |
55
 Siddarth Kaul Bowler |
10 | 36.5 | 16 | 8.14 | 18.75 | 13.8 | 68 | 30.8% | 0 | 4 |
56
 Thangarasu Natarajan Bowler |
6 | 13.4 | 2 | 8.41 | 57.50 | 41.0 | 25 | 30.5% | 0 | 1 |
57
 Kuldeep Yadav Bowler |
12 | 41.4 | 12 | 8.16 | 28.33 | 20.8 | 76 | 30.4% | 0 | 2 |
58
 Bipul Sharma Bowler |
7 | 16.4 | 3 | 7.74 | 43.00 | 33.3 | 30 | 30.0% | 0 | 1 |
59
 Dhawal Kulkarni Bowler |
6 | 19.4 | 3 | 8.80 | 57.67 | 39.3 | 35 | 29.7% | 0 | 1 |
60
 Piyush Chawla All-rounder |
6 | 20.2 | 6 | 8.80 | 29.83 | 20.3 | 36 | 29.5% | 0 | 2 |
61
 Axar Patel All-rounder |
14 | 49 | 15 | 7.39 | 24.13 | 19.6 | 86 | 29.3% | 0 | 3 |
62
 Shane Watson All-rounder |
8 | 27.3 | 5 | 8.91 | 49.00 | 33.0 | 48 | 29.1% | 0 | 1 |
63
 Basil Thampi Bowler |
12 | 46.2 | 11 | 9.15 | 38.55 | 25.3 | 79 | 28.4% | 0 | 3 |
64
 Suresh Raina Batter |
14 | 12 | 1 | 8.50 | 102.00 | 72.0 | 20 | 27.8% | 0 | 1 |
65
 Ravindra Jadeja All-rounder |
12 | 38.1 | 5 | 9.14 | 69.80 | 45.8 | 60 | 26.2% | 0 | 2 |
66
 James Faulkner All-rounder |
8 | 26.3 | 6 | 9.74 | 43.00 | 26.5 | 41 | 25.8% | 0 | 2 |
67
 Ben Cutting All-rounder |
4 | 13.1 | 1 | 9.34 | 123.00 | 79.0 | 20 | 25.3% | 0 | 1 |
68
 Dwayne Smith Batter |
12 | 13.4 | 2 | 10.83 | 74.00 | 41.0 | 20 | 24.4% | 0 | 1 |
69
 KC Cariappa Bowler |
4 | 15.4 | 4 | 8.11 | 31.75 | 23.5 | 22 | 23.4% | 0 | 2 |
70
 Moises Henriques All-rounder |
12 | 24.4 | 1 | 10.05 | 248.00 | 148.0 | 27 | 18.2% | 0 | 1 |
71
 Corey Anderson All-rounder |
11 | 20.1 | 3 | 9.22 | 62.00 | 40.3 | 21 | 17.4% | 0 | 1 |
72
 Marcus Stoinis All-rounder |
5 | 11.3 | 2 | 9.57 | 55.00 | 34.5 | 11 | 15.9% | 0 | 1 |
Indian Premier League Stats Questions
Indian Premier League 2017 player and team stats: runs, averages and strike rates, wickets and economy, fielding and Dream11 points, and every side's batting, bowling and fielding. Statz tracks Indian Premier League 2017 across the points table, season leaderboards and venue scoring trends, updated after every completed match.
Indian Premier League on Statz
Frequently asked questions
Who scored the most runs in the Indian Premier League 2017?
David Warner (Sunrisers Hyderabad) with 641 runs in 14 matches, at a strike rate of 141.8.
Who took the most wickets in the Indian Premier League 2017?
Bhuvneshwar Kumar (Sunrisers Hyderabad) with 26 wickets at 6.83 an over.
Who hit the most sixes in the Indian Premier League 2017?
Glenn Maxwell with 26 sixes.