



























Indian Premier League 2017
 India
Mumbai Indians won the IPL 2017 final, beating Rising Pune Supergiants by 1 run at Rajiv Gandhi International Stadium
Table · Final
| # | Team · next match | P | W | L | NR | T | Pts | NRR | Form |
|---|---|---|---|---|---|---|---|---|---|
| Qualifier 1 | |||||||||
| 1 | 14 | 10 | 4 | 0 | 0 | 20 | +0.596 | ||
| Qualifier 1 | |||||||||
| 1 | 3 | 2 | 1 | 0 | 0 | 4 | +0.667 | – | |
| Qualifier 1 | |||||||||
| 1 | 3 | 2 | 1 | 0 | 0 | 4 | +0.200 | – | |
| Qualifier 1 | |||||||||
| 1 | 5 | 3 | 1 | 1 | 0 | 7 | +2.113 | – | |
| Qualifier 1 | |||||||||
| 1 | 5 | 4 | 1 | 0 | 0 | 8 | +1.319 | – | |
| Qualifier 1 | |||||||||
| 1 | 14 | 8 | 1 | 0 | 5 | 250 | 0.000 | – | |
| Qualifier 1 | |||||||||
| 1 | 5 | 4 | 1 | 0 | 0 | 8 | +0.889 | – | |
| 2 | 14 | 9 | 5 | 0 | 0 | 18 | +0.176 | ||
| 2 | 3 | 2 | 1 | 0 | 0 | 4 | −0.162 | – | |
| 2 | 3 | 2 | 1 | 0 | 0 | 4 | +0.105 | – | |
| 2 | 5 | 3 | 1 | 1 | 0 | 7 | +0.425 | – | |
| 2 | 5 | 3 | 2 | 0 | 0 | 6 | +1.028 | – | |
| 2 | 14 | 7 | 1 | 0 | 6 | 225 | 0.000 | – | |
| 2 | 4 | 3 | 0 | 1 | 0 | 7 | +0.720 | ||
| Eliminator | |||||||||
| 3 | 14 | 8 | 5 | 0 | 0 | 16 | +0.658 | ||
| Eliminator | |||||||||
| 3 | 3 | 1 | 2 | 0 | 0 | 2 | +0.730 | – | |
| Eliminator | |||||||||
| 3 | 3 | 1 | 2 | 0 | 0 | 2 | +0.304 | – | |
| Eliminator | |||||||||
| 3 | 5 | 3 | 1 | 1 | 0 | 7 | −0.173 | – | |
| Eliminator | |||||||||
| 3 | 5 | 2 | 2 | 1 | 0 | 5 | +0.874 | – | |
| Eliminator | |||||||||
| 3 | 14 | 9 | 4 | 0 | 1 | 224 | 0.000 | – | |
| Eliminator | |||||||||
| 3 | 4 | 3 | 1 | 0 | 0 | 6 | +1.148 | ||
| 4 | 14 | 8 | 6 | 0 | 0 | 16 | +0.629 | ||
| 4 | 3 | 1 | 2 | 0 | 0 | 2 | −1.235 | – | |
| 4 | 3 | 1 | 2 | 0 | 0 | 2 | −0.563 | – | |
| 4 | 5 | 2 | 3 | 0 | 0 | 4 | −0.422 | – | |
| 4 | 5 | 2 | 3 | 0 | 0 | 4 | −0.849 | – | |
| 4 | 14 | 7 | 3 | 0 | 4 | 202 | 0.000 | – | |
| 4 | 5 | 2 | 3 | 0 | 0 | 4 | +0.576 | ||
| 5 | 14 | 7 | 7 | 0 | 0 | 14 | −0.062 | ||
| 5 | 5 | 1 | 3 | 1 | 0 | 3 | −1.567 | – | |
| 5 | 5 | 2 | 3 | 0 | 0 | 4 | −1.176 | – | |
| 5 | 14 | 4 | 5 | 0 | 5 | 158 | 0.000 | – | |
| 5 | 4 | 2 | 2 | 0 | 0 | 4 | +0.322 | ||
| 6 | 14 | 6 | 8 | 0 | 0 | 12 | −0.312 | ||
| 6 | 5 | 0 | 3 | 2 | 0 | 2 | −0.571 | – | |
| 6 | 5 | 1 | 3 | 1 | 0 | 3 | −1.138 | – | |
| 6 | 14 | 2 | 5 | 0 | 7 | 154 | 0.000 | – | |
| 6 | 4 | 2 | 2 | 0 | 0 | 4 | −0.029 | – | |
| 7 | 14 | 4 | 10 | 0 | 0 | 8 | −0.412 | ||
| 7 | 14 | 3 | 6 | 0 | 5 | 149 | 0.000 | – | |
| 7 | 4 | 2 | 2 | 0 | 0 | 4 | −0.427 | – | |
| 8 | 14 | 3 | 10 | 0 | 0 | 6 | −1.299 | ||
| 8 | 14 | 2 | 6 | 0 | 6 | 141 | 0.000 | – | |
| 8 | 5 | 2 | 3 | 0 | 0 | 4 | −0.846 | – | |
| 9 | 14 | 1 | 6 | 0 | 7 | 138 | 0.000 | – | |
| 9 | 4 | 1 | 3 | 0 | 0 | 2 | −0.772 | ||
| 10 | 14 | 2 | 8 | 0 | 4 | 114 | 0.000 | – | |
| 10 | 5 | 0 | 4 | 1 | 0 | 1 | −1.383 | ||















Top Run Scorers

 David WarnerSRH · 14 matches · SR 141.8
641
2

 Gautam GambhirKKR · 16 matches · SR 128.0
498
3
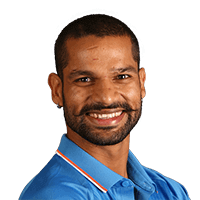 Shikhar DhawanSRH · 14 matches · SR 127.4
479
4

 Steven SmithRPS · 15 matches · SR 122.0
472
5

 Suresh RainaGL · 14 matches · SR 144.0
442
6

 Hashim AmlaPBKS · 10 matches · SR 145.8
420
7
 Manish PandeyKKR · 13 matches · SR 128.6
396
8

 Parthiv PatelMI · 16 matches · SR 134.8
395
9
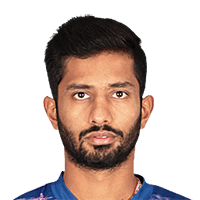 Rahul TripathiRPS · 14 matches · SR 146.4
391
10
 Robin UthappaKKR · 13 matches · SR 165.1
388
Top Wicket Takers
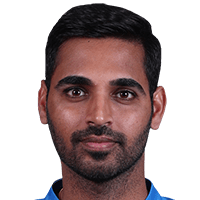 Bhuvneshwar KumarSRH · 14 matches · Econ 6.83
26
2
 Jaydev UnadkatRPS · 12 matches · Econ 6.92
24
3

 Jasprit BumrahRCB · 16 matches · Econ 7.23
20
4
 Mitchell McClenaghanMI · 14 matches · Econ 8.82
19
5
 Imran TahirRPS · 12 matches · Econ 7.74
18
6
 Rashid KhanSRH · 14 matches · Econ 6.55
17
7
 Chris WoakesGL · 13 matches · Econ 8.33
17
8
 Sandeep SharmaPBKS · 13 matches · Econ 7.96
17
9
 Umesh YadavKKR · 14 matches · Econ 8.09
17
10
 Pawan NegiRCB · 12 matches · Econ 5.91
16
Fixtures & Results
 Sunrisers Hyderabad
207/4(20)
 Royal Challengers Bengaluru
172/10(19.4)
 Rising Pune Supergiants
187/3(19.5)
 Mumbai Indians
184/8(20)
 Gujarat Lions
183/4(20)
 Kolkata Knight Riders
184/0(14.5)
 Punjab Kings
164/4(19)
Rising Pune Supergiants
163/6(20)
Royal Challengers Bengaluru
157/8(20)
 Delhi Capitals
142/9(20)
Sunrisers Hyderabad
140/1(15.3)
Gujarat Lions
135/7(20)
Mumbai Indians
180/6(19.5)
Kolkata Knight Riders
178/7(20)
Punjab Kings
150/2(14.3)
Royal Challengers Bengaluru
148/4(20)
Rising Pune Supergiants
108/10(16.1)
Delhi Capitals
205/4(20)
Mumbai Indians
159/6(18.4)
Sunrisers Hyderabad
158/8(20)
Kolkata Knight Riders
171/2(16.3)
Punjab Kings
170/9(20)
Royal Challengers Bengaluru
142/5(20)
Mumbai Indians
145/6(18.5)
Gujarat Lions
172/3(18)
Rising Pune Supergiants
171/8(20)
Kolkata Knight Riders
172/6(20)
Sunrisers Hyderabad
155/6(20)
Delhi Capitals
188/6(20)
Punjab Kings
137/9(20)
Mumbai Indians
177/4(19.3)
Gujarat Lions
176/4(20)
Royal Challengers Bengaluru
134/9(20)
Rising Pune Supergiants
161/8(20)
Delhi Capitals
168/7(20)
Kolkata Knight Riders
169/6(19.5)
Sunrisers Hyderabad
159/6(20)
Punjab Kings
154/10(19.4)
Gujarat Lions
192/7(20)
Royal Challengers Bengaluru
213/2(20)
Sunrisers Hyderabad
191/4(20)
Delhi Capitals
176/5(20)
Punjab Kings
198/4(20)
Mumbai Indians
199/2(15.3)
Kolkata Knight Riders
187/6(20)
Gujarat Lions
188/6(18.2)
Rising Pune Supergiants
179/4(20)
Sunrisers Hyderabad
176/3(20)
Mumbai Indians
142/8(20)
Delhi Capitals
128/7(20)
Gujarat Lions
162/7(20)
Punjab Kings
188/7(20)
Kolkata Knight Riders
131/10(19.3)
Royal Challengers Bengaluru
49/10(9.4)
Mumbai Indians
157/8(20)
Rising Pune Supergiants
160/6(20)
Royal Challengers Bengaluru
15:30
Sunrisers Hyderabad
15:30
Rising Pune Supergiants
182/5(20)
Kolkata Knight Riders
184/3(18.1)
Royal Challengers Bengaluru
134/10(20)
Gujarat Lions
135/3(13.5)
Kolkata Knight Riders
161/3(16.2)
Delhi Capitals
160/6(20)
Punjab Kings
181/9(20)
Sunrisers Hyderabad
207/3(20)
Rising Pune Supergiants
157/3(20)
Royal Challengers Bengaluru
96/9(20)
Gujarat Lions
153/9(20)
Mumbai Indians
153/10(20)
Punjab Kings
68/0(7.5)
Delhi Capitals
67/10(17.1)
Sunrisers Hyderabad
209/3(20)
Kolkata Knight Riders
161/7(20)
Mumbai Indians
165/5(19.5)
Royal Challengers Bengaluru
162/8(20)
Rising Pune Supergiants
167/5(19.5)
Gujarat Lions
161/10(19.5)
Delhi Capitals
189/4(19.1)
Sunrisers Hyderabad
185/3(20)
Kolkata Knight Riders
155/8(20)
Rising Pune Supergiants
158/6(19.2)
Delhi Capitals
214/3(17.3)
Gujarat Lions
208/7(20)
Royal Challengers Bengaluru
119/10(19)
Punjab Kings
138/7(20)
Sunrisers Hyderabad
136/9(20)
Rising Pune Supergiants
148/8(20)
Delhi Capitals
66/10(13.4)
Mumbai Indians
212/3(20)
Royal Challengers Bengaluru
158/6(20)
Kolkata Knight Riders
159/4(15.1)
Punjab Kings
189/3(20)
Gujarat Lions
192/4(19.4)
Sunrisers Hyderabad
140/3(18.2)
Mumbai Indians
138/7(20)
Punjab Kings
167/6(20)
Kolkata Knight Riders
153/6(20)
Gujarat Lions
195/5(20)
Delhi Capitals
197/8(19.4)
Mumbai Indians
223/6(20)
Punjab Kings
230/3(20)
Delhi Capitals
168/8(20)
Rising Pune Supergiants
161/7(20)
Gujarat Lions
154/10(19.2)
Sunrisers Hyderabad
158/2(18.1)
Kolkata Knight Riders
164/8(20)
Mumbai Indians
173/5(20)
Rising Pune Supergiants
78/1(12)
Punjab Kings
73/10(15.5)
Delhi Capitals
151/10(20)
Royal Challengers Bengaluru
161/6(20)
Mumbai Indians
142/9(20)
Rising Pune Supergiants
162/4(20)
Sunrisers Hyderabad
128/7(20)
Kolkata Knight Riders
48/3(5.2)
Mumbai Indians
111/4(14.3)
Kolkata Knight Riders
107/10(18.5)
Rising Pune Supergiants
128/6(20)
Mumbai Indians
129/8(20)
Power Rankings
| # | Team | Bat | Bowl | Ovr |
|---|---|---|---|---|
| 1 | Mumbai Indians |
103.0 | 94.1 | +8.9 |
| 2 | Kolkata Knight Riders |
104.7 | 98.1 | +6.5 |
| 3 | Sunrisers Hyderabad |
104.1 | 99.3 | +4.9 |
| 4 | Rising Pune Supergiants |
95.8 | 93.2 | +2.6 |
| 5 | Punjab Kings |
101.8 | 101.9 | -0.1 |
| 6 | Gujarat Lions |
107.5 | 112.5 | -5.0 |
| 7 |  Delhi Capitals |
96.8 | 103.0 | -6.2 |
| 8 | Royal Challengers Bengaluru |
85.6 | 101.2 | -15.7 |
Player Stats
 Glenn MaxwellPBKS · 14 matches · SR 173.2
26
2
David WarnerSRH · 14 matches · SR 141.8
26
3
 Rishabh PantDC · 14 matches · SR 165.6
24
4
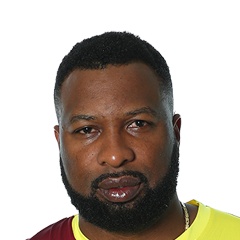 Kieron PollardMI · 17 matches · SR 139.5
22
5
Robin UthappaKKR · 13 matches · SR 165.1
21
 Chris LynnKKR · 295 runs
181.0
2
Glenn MaxwellPBKS · 310 runs
173.2
3
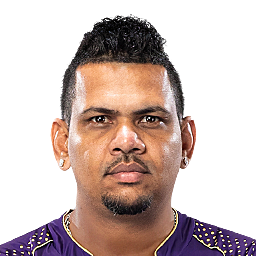 Sunil NarineGL · 224 runs
172.3
4
 Aaron FinchGL · 299 runs
166.1
5
Rishabh PantDC · 366 runs
165.6


Statz MVP
 Chris MorrisDC · 9 matches · a match
85.1
2
 Ben StokesRPS · 12 matches · a match
75.6
3
Pawan NegiRCB · 12 matches · a match
69.6
4
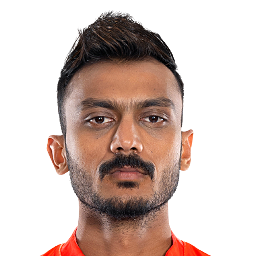 Axar PatelPBKS · 14 matches · a match
66.8
5
Bhuvneshwar KumarSRH · 14 matches · a match
62.6



Team Stats
Gujarat Lions14 games
171.9
2
Sunrisers Hyderabad14 games
167.8
3
Mumbai Indians17 games
164.1
4
Delhi Capitals14 games
158.5
5
Punjab Kings14 games
157.6
Sixes
| # | Team | Last 5 | O6.5 | Avg |
|---|---|---|---|---|
| 1 | PBKS |
375122 | 50% | 6.3 |
| 2 | MI |
145715 | 47% | 6.9 |
| 3 | RCB |
18367 | 46% | 5.8 |
| 4 | KKR |
104733 | 38% | 5.4 |
| 5 | GL |
511666 | 36% | 6.6 |
Match Totals
| # | Team | Last 5 | O320.5 | Avg |
|---|---|---|---|---|
| 1 | GL |
328422381392312 | 71% | 348.4 |
| 2 | KKR |
317320337176218 | 63% | 313.9 |
| 3 | PBKS |
257381320453151 | 57% | 316.9 |
| 4 | DC |
422278392329312 | 57% | 319.6 |
| 5 | SRH |
374284278312176 | 50% | 322.5 |
Streaks
Karun NairDelhi Capitals · avg 35.3
4
2
Ajinkya RahaneRising Pune Supergiants · avg 44.7
3
3
Ishan KishanGujarat Lions · avg 41.3
3
Grounds
| # | Ground | M | Chased | 1st Inns |
|---|---|---|---|---|
| 1 | Himachal Pradesh Cricket Association StadiumDharamsala | 11 | 27% | 219 |
| 2 | Sawai Mansingh StadiumJaipur | 42 | 60% | 215 |
| 3 | Maharaja Yadavindra Singh International Cricket Stadium, MullanpurChandigarh | 17 | 53% | 215 |
| 4 | Wankhede StadiumMumbai | 108 | 50% | 214 |
| 5 | Rajiv Gandhi International StadiumHyderabad | 49 | 45% | 211 |
Indian Premier League Questions
Mumbai Indians won the Indian Premier League 2017 final, beating Rising Pune Supergiants by 1 run at Rajiv Gandhi International Stadium. Mumbai Indians finished top of the Indian Premier League 2017 standings on 20 points from 14 matches, 16 points clear of Sri Lanka. David Warner has the most runs (641). Bhuvneshwar Kumar has the most wickets (26). Statz tracks Indian Premier League 2017 across the points table, season leaderboards and venue scoring trends, updated after every completed match.
Indian Premier League on Statz
Frequently asked questions
Who won the IPL 2017?
Mumbai Indians won the Indian Premier League 2017 final, beating Rising Pune Supergiants by 1 run at Rajiv Gandhi International Stadium. Across the season, David Warner scored the most runs (641 runs) and Bhuvneshwar Kumar took the most wickets (26 wickets).
Who finished top of the table in IPL 2017?
Mumbai Indians finished top of the Indian Premier League 2017 standings on 20 points from 14 matches, 16 points clear of Sri Lanka.
Who scored the most runs in IPL 2017?
David Warner (Sunrisers Hyderabad) finished top with 641 runs, ahead of Gautam Gambhir (498) and Shikhar Dhawan (479). The IPL 2017 runs leaderboard ranks every player, with their team and matches.
Who took the most wickets in IPL 2017?
Bhuvneshwar Kumar (Sunrisers Hyderabad) finished top with 26 wickets, ahead of Jaydev Unadkat (24) and Jasprit Bumrah (20). The IPL 2017 wickets leaderboard ranks every player, with their team and matches.
Who hit the most sixes in IPL 2017?
Glenn Maxwell and David Warner shared the lead with 26 sixes, ahead of Rishabh Pant (24) and Kieron Pollard (22). The IPL 2017 sixes leaderboard ranks every player, with their team and matches.
What were the latest results in IPL 2017?
Rising Pune Supergiants vs Mumbai Indians (21 May): Mumbai Indians won by 1 run. Mumbai Indians vs Kolkata Knight Riders (19 May): Mumbai Indians won by 6 wickets (with 33 balls remaining). Sunrisers Hyderabad vs Kolkata Knight Riders (17 May): Kolkata Knight Riders won by 7 wickets (with 4 balls remaining) (D/L method).