How to use Statz Team Profile Page
Overview
The Statz Team Profile page is your one-stop destination for comprehensive team statistics, form analysis, and historical performance data that goes far beyond basic league tables and results. Whether you’re researching Manchester United’s recent defensive record, Arsenal’s possession stats, or Liverpool’s attacking output across different competitions, the Team Profile page consolidates everything you need into a single, intuitive interface.
Where to Find Team Profiles
Team Profile pages are accessible throughout the Statz platform. You can reach them by:
- Clicking any team badge or name in fixtures, standings, or projections
- Navigating via the search bar (as shown below)
- Using the URL format: statz.ai/team/[team-name]

Understanding the Page Layout
When you first land on the team detail page it will look like the image below. For this guide, we’ll use Manchester United as our example: statz.ai/team/manchester-united.
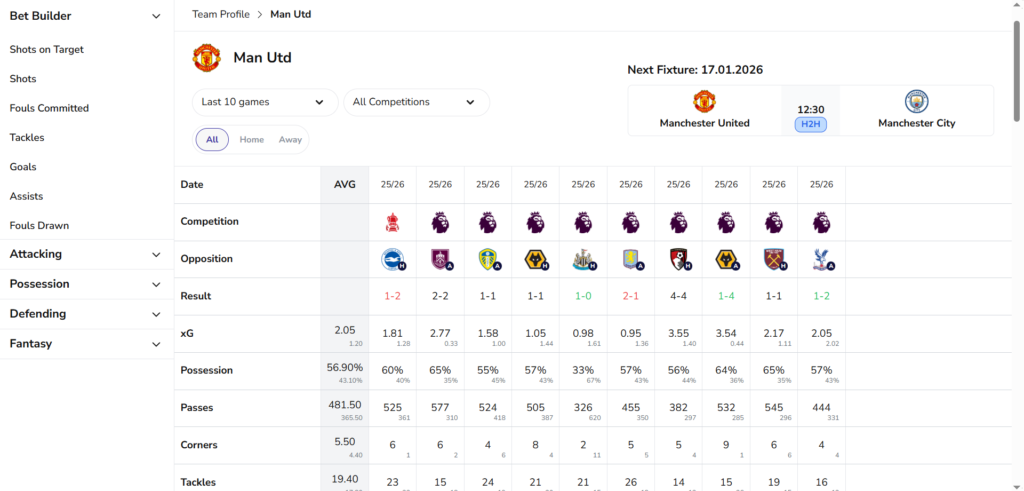
At the top of the page we show the team’s upcoming match (in our example: Man United vs Man City) with date and kick-off time. Click on the H2H button to be taken to the head-to-head page for this fixture (for a guide on H2H pages see here).
Underneath the header section is a fully customisable tabular overview of key team statistics. This table shows match-by-match data across the filtered sample size. Attached to this we offer 3 different filters: Game/Season Dropdown, Competition Dropdown and Venue Toggle.
Lastly, we have a list of grouped statistics that when clicked take you to our team detail pages. These pages show player stat totals per fixture for the selected team.
Team Stat Table
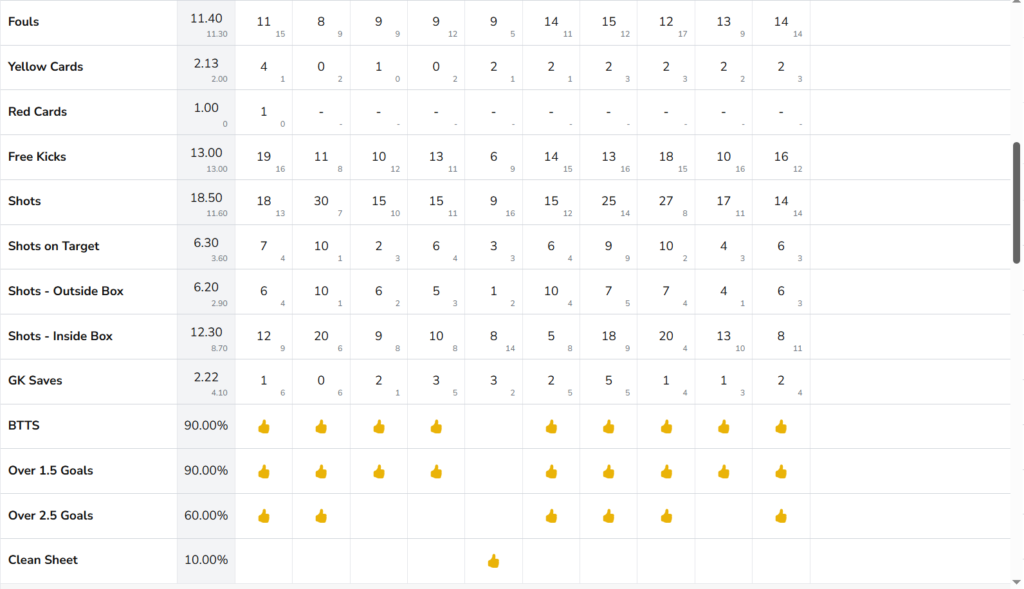
In the image above, the top of the stat table is shown. By default it shows the last 10 games in all competitions. Each column represents a different fixture, and each row shows a specific statistic. Within each cell is the team total for that fixture in the centre along with the opponents total in the bottom right corner. The grey column holds the team and opponent average over the selected period. We have placed the key statistics towards the top of the table but scroll down to explore more stats, like in the image below.
Next, let’s take a look at how you can customise your analysis with our filters:
Game/Season Dropdown
This dropdown controls the sample size of matches displayed in your statistical view. Options include:
- Last 5 games
- Last 10 games (default)
- Last 30 games
- Whole seasons (e.g. 2025/26)
How to use it: Adjust this based on what you’re researching. Recent form (Last 5-10 games) is more predictive for upcoming fixtures, while full season data (Season total) smooths out variance and shows longer-term trends. If you’re analysing “have Manchester United improved since a managerial change?” you might compare Last 5 games vs Season total.
Competition Dropdown
This filter lets you narrow the data by competition, or keep it on “All Competitions” to see aggregate statistics across all tournaments.
How to use it: Filter to a specific competition or multiple competitions when fixture context matters. For example, if Manchester United have a Champions League fixture coming up, filtering to “UEFA Champions League” shows their European form specifically, which often differs from domestic league performance.
Home / Away / All Toggle
Below the two dropdowns, you’ll see three buttons:
- All (default) — Shows statistics across all venues
- Home — Shows only home fixture statistics
- Away — Shows only away fixture statistics
Why this matters: Home and away performance splits are massive in football analytics. A team might average 2.5 goals per game at home but only 1.2 away. For match analysis and betting, always check the relevant venue split. In our Manchester United example, if they’re playing Man City at home next, clicking “Home” gives you their home-specific stats to assess how they’ll likely perform.
Putting Team Profile Data Into Action
Example 1: Analysing Manchester United’s Premier League Season
You want to assess how United have performed so far in the Premier League this season. Here’s how to use the Team Profile page:
- Step 1: Set the Game/Season Dropdown to “2025/2026” to filter to this season only
- Step 2: Set the Competition Dropdown to “Premier League” for league games only
- Step 3: Scroll across to see all United games this season, scroll down to see all metrics
- Step 4: Check the key metrics:
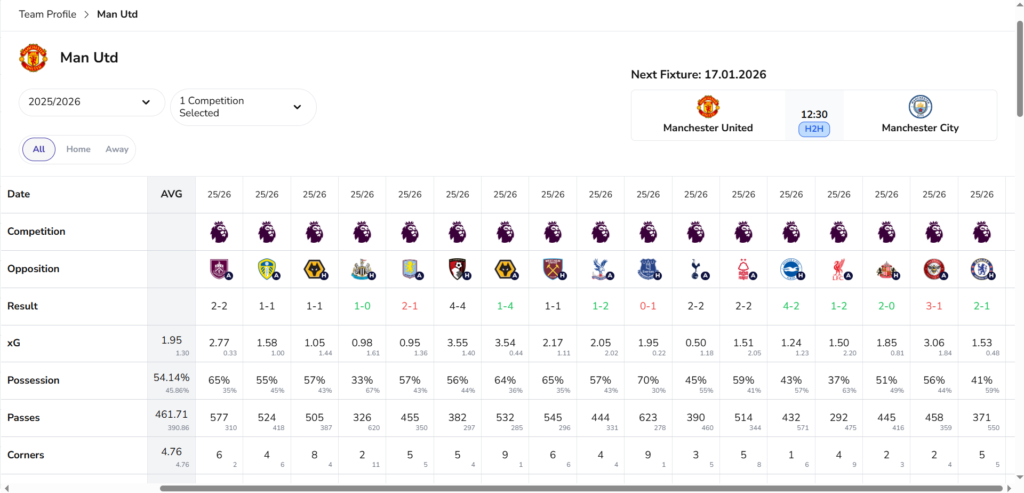
Tip: Check the average column to gauge how the team has performed over this period. For example Man Utd average 1.95 xG per game vs 1.30 xG conceded per game – showing some strong underlying numbers, often bettering their opponents in chance creation.
Example 2: Selecting Multiple Competitions and Filters
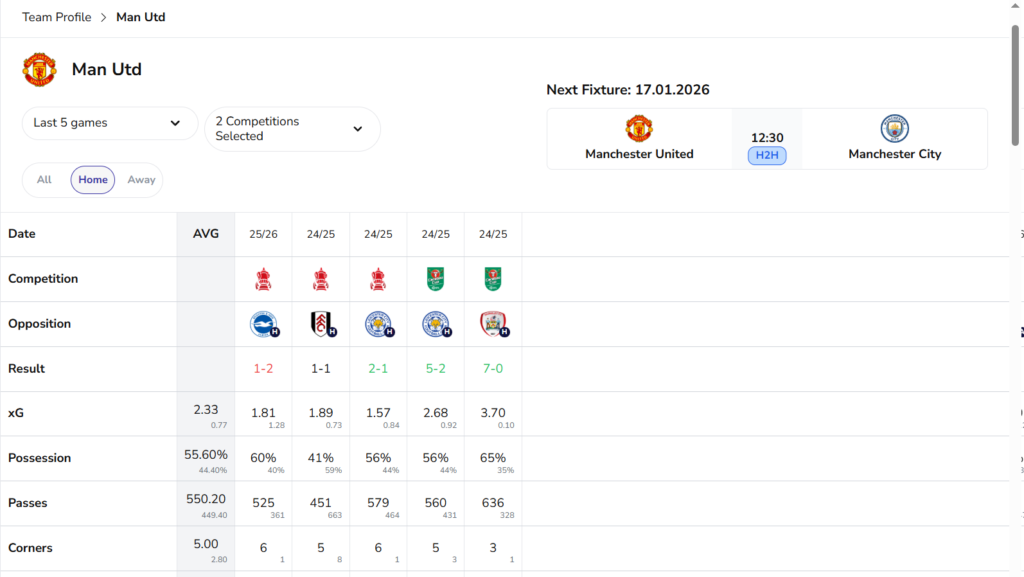
In the image below, I have combined all three filters. The steps I took where:
- Step 1: Set the Game/Season Dropdown to “Last 5 Games” to filter to this season only
- Step 2: Set the Competition Dropdown to “FA Cup“ and “Carabao Cup“ for cup games only
- Step 3: Click the “Home” button to see home fixtures only
- Step 4: Check the key metrics:
Example 3: Cross-Reference with Opponent Team Profiles
Never analyze one team in isolation. Always visit both teams’ profiles before making predictions:
- United’s xG vs Opponent’s xG conceded
- United’s corners won vs Opponent’s corners conceded
- United’s cards vs Opponent’s fouls committed
For example before the Manchester Derby it would be wise to check the Man City team profile page and compare results to United’s. The intersection of these data points is where betting value lives.
The Left Sidebar: Quick Navigation
The left sidebar provides one-click access to specific statistical categories within your selected team. These collapsible sections include:
- Bet Builder — Common bet builder markets (shots on target, fouls etc)
- Attacking — Goals, assists, shots etc
- Possession — Passes, crosses, dribbles etc
- Defending — Tackles, clearances, duels won etc
- Fantasy — FPL-related data (points, defensive contributions, bonus points)
For example, this is Man Utd’s Shots On Target team detail page, where you will see a breakdown of how many Shots On Target each Man Utd player has had over your selected period. For a guide on team detail pages click here.
Understanding the Data Limitations
What Team Profiles Can’t Tell You
- Team news and injuries: A star striker being injured changes everything
- Managerial changes: A new manager’s “bounce” effect isn’t reflected in historical stats
- Motivation factors: Cup finals, relegation battles, and derbies skew statistics
- Referee assignments: A strict ref dramatically impacts card and foul counts
Best Practices
✅ Use venue splits (Home/Away) whenever possible for accurate predictions
✅ Filter by competition when assessing European or cup fixtures
✅ Compare short-term (Last 5) vs long-term (Season) averages to spot trends
✅ Cross-reference with opponent Team Profiles for complete match analysis
✅ Check xG variance to identify over/underperforming teams
❌ Don’t ignore team news — stats are only predictive if the same players are playing
❌ Don’t assume recent form continues forever — variance happens
❌ Don’t forget the “Next Fixture” widget at the top — it tells you who’s up next!
Conclusion
The Statz Team Profile page transforms raw match data into actionable intelligence. By mastering the filters (Last X Games, Competition, Home/Away), understanding the statistical rows (xG, Possession, Tackles, Cards), and cross-referencing with opponent profiles, you’ll make smarter bets, better FPL decisions, and develop deeper tactical insight into how teams perform.
Visit statz.ai/team/[any-team-name] to start exploring comprehensive team statistics today.