





























Quetta Gladiators Stats
Quetta Gladiators PSL Strike Rate Stats
How fast Quetta Gladiators score, and who bats quickest, game by game
Updated 25 April 2026, after the Karachi Kings game
| Player | Avg | Hit % | ||||||||||
|---|---|---|---|---|---|---|---|---|---|---|---|---|
| Quetta Gladiators total | 144.3 | 162.5 | 156.7 | 125.7 | 140.8 | 128.3 | 151.7 | 138.3 | 152.5 | 145.0 | 139.2 | |
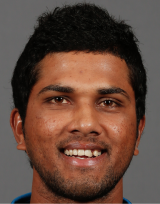 D. ChandimalKeeper, 3 batted |
173.3 | 67%2/3 | 17730 (17) | 23819 (8) | 603 (5) | |||||||
 A. DaniyalBowler, 3 batted |
160.0 | 67%2/3 | 24422 (9) | -DNB | 756 (8) | 1334 (3) | ||||||
 A. AhmedBowler, 4 batted |
148.0 | 50%2/4 | -DNB | 17124 (14) | 501 (2) | -DNB | 503 (6) | -DNB | -DNB | -DNB | 3009 (3) | -DNB |
|
S
S. HussainBatter, 9 batted
|
146.3 | 44%4/9 | 00 (1) | 17153 (31) | 11721 (18) | 00 (3) | 12012 (10) | 502 (4) | 14021 (15) | 13254 (41) | 21752 (24) | |
|
J
J. KhanAll-rounder, 4 batted
|
143.5 | 25%1/4 | 603 (5) | 603 (5) | -DNB | 866 (7) | 35021 (6) | |||||
 R. RossouwBatter, 9 batted |
142.8 | 33%3/9 | 16790 (54) | 21462 (29) | 00 (1) | 12260 (49) | 14426 (18) | 12653 (42) | 331 (3) | 00 (5) | 11925 (21) | |
 T. CurranAll-rounder, 5 batted |
140.7 | 60%3/5 | 15015 (10) | 331 (3) | 13229 (22) | 17231 (18) | 00 (1) | |||||
 B. McDermottKeeper, 3 batted |
140.0 | 33%1/3 | 503 (6) | 00 (1) | 19225 (13) | |||||||
 B. JacobsBatter, 6 batted |
136.0 | 33%2/6 | 402 (5) | 12634 (27) | 23314 (6) | 603 (5) | 15849 (31) | 00 (1) | ||||
|
H
H. NawazBatter, 10 batted
|
134.1 | 40%4/10 | 603 (5) | 00 (1) | 835 (6) | 15349 (32) | 10637 (35) | 24439 (16) | 9120 (22) | 18366 (36) | 13353 (40) | 7919 (24) |
 S. ShakeelBatter, 10 batted |
132.1 | 40%4/10 | 16857 (34) | 10017 (17) | 12012 (10) | 331 (3) | 12316 (13) | 10842 (39) | 13756 (41) | 16242 (26) | 1004 (4) | 13233 (25) |
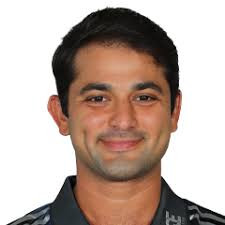 K. NafayBatter, 8 batted |
124.2 | 50%4/8 | 00 (2) | 10912 (11) | 15420 (13) | 1506 (4) | 17112 (7) | 12918 (14) | 1506 (4) | 433 (7) | ||
 A. JosephBowler, 6 batted |
110.0 | 33%2/6 | 1002 (2) | 503 (6) | 12719 (15) | -DNB | 1506 (4) | -0 balls | -DNB | 00 (1) | 1503 (2) | |
|
S
S. KhanAll-rounder, 1 batted
|
200.0 | 100%1/1 | 2004 (2) | -DNB | -DNB | |||||||
 A. AliBatter, 1 batted |
133.3 | 100%1/1 | 1334 (3) | |||||||||
 S. HarperBatter, 1 batted |
114.3 | 0%0/1 | 1148 (7) | |||||||||
 K. BhattiAll-rounder, 1 batted |
100.0 | 0%0/1 | 1001 (1) | |||||||||
 B. HamptonAll-rounder, 1 batted |
100.0 | 0%0/1 | 1007 (7) | |||||||||
 U. TariqBowler, 2 batted |
47.1 | 0%0/2 | -DNB | -DNB | 477 (15) | -DNB | 501 (2) | -DNB | -DNB | -DNB | -DNB | -DNB |

A green cell reached the line. The line under a strike rate is the runs and the balls faced; DNB did not bat.
Quetta Gladiators Team Strike rate
Line145.5
Avg144.3151.9
Hit40%
Quetta Gladiators Strike rate Match by Match
The last 10 PSL matches and how often Quetta Gladiators went over the line
Line145.5
| Opponent | Result | For | Ag | 145.5+ |
|---|---|---|---|---|
| Avg | 144.1 | 151.8 | 40% | |
 Karachi Kings (H)25 Apr |
Lby 9 wickets | 162.5 | 179.3 | |
 Lahore Qalandars (A)21 Apr |
Lby 9 runs | 156.7 | 164.2 | |
 Peshawar Zalmi (A)19 Apr |
Lby 118 runs | 125.7 | 212.5 | |
| Lahore Qalandars (A)17 Apr |
Wby 6 wickets | 140.8 | 112.6 | |
| Peshawar Zalmi (A)15 Apr |
Lby 8 wickets | 128.3 | 140.5 | |
 Rawalpindiz (H)10 Apr |
Wby 61 runs | 151.7 | 115.2 | |
 Multan Sultans (A)5 Apr |
Lby 6 wickets | 138.3 | 159.0 | |
 Islamabad United (A)2 Apr |
Lby 8 wickets | 152.5 | 171.8 | |
 Hyderabad Kingsmen (A)29 Mar |
Wby 40 runs | 145.0 | 111.7 | |
| Karachi Kings (H)27 Mar |
Lby 14 runs | 139.2 | 150.8 |
Quetta Gladiators Strike rate Lines
How often each line went over, last 10 PSL matches
| Line | Over | Under | Over % |
|---|---|---|---|
| 135.5 | 8 | 2 | 80% |
| 140.5 | 6 | 4 | 60% |
| 145.5 | 4 | 6 | 40% |
| 150.5 | 4 | 6 | 40% |
| 155.5 | 2 | 8 | 20% |
| Line | Over | Under | Over % |
|---|
Strike rate Batting First and Chasing
Quetta Gladiators's strike rate per game by when they batted
| Batting | P | W | For | Ag |
|---|---|---|---|---|
| First | 6 | 2 | 146.4 | 146.3 |
| Second | 4 | 1 | 140.6 | 160.0 |
PSL 2026 Strike rate Table
Strike rate, this season
| Side | P | For | Ag |
|---|---|---|---|
| 1Peshawar Zalmi |
11 | 167.3 | 135.1 |
| 2Multan Sultans |
11 | 166.8 | 166.2 |
| 3Islamabad United |
11 | 152.8 | 138.5 |
| 4Hyderabad Kingsmen |
13 | 146.6 | 148.1 |
| 5Karachi Kings |
10 | 146.6 | 160.4 |
| 6Lahore Qalandars |
10 | 146.3 | 150.8 |
| 7Quetta Gladiators |
10 | 144.3 | 149.5 |
| 8Rawalpindiz |
10 | 139.2 | 165.2 |
Quetta Gladiators PSL Strike rate Questions
What is Quetta Gladiators's strike rate in PSL matches?
Quetta Gladiators have scored at a strike rate of 144.3 over their last 10 PSL matches, their opponents at 151.9.
How often do Quetta Gladiators bat at a strike rate over 145.5?
Quetta Gladiators went over 145.5 in 4 of their last 10 PSL matches.
Who has the best strike rate for Quetta Gladiators?
Over Quetta Gladiators's last 10 PSL matches, batting three times or more: Dinesh Chandimal (173.3 in 3 innings), Ahmed Daniyal (160.0 in 3 innings), Abrar Ahmed (148.0 in 4 innings).