





























Lahore Qalandars Stats
Lahore Qalandars PSL Strike Rate Stats
How fast Lahore Qalandars score, and who bats quickest, game by game
Updated 25 April 2026, after the Peshawar Zalmi game
| Player | Avg | Hit % | ||||||||||
|---|---|---|---|---|---|---|---|---|---|---|---|---|
| Lahore Qalandars total | 146.3 | 170.9 | 165.8 | 164.2 | 175.0 | 112.6 | 95.1 | 90.1 | 237.2 | 106.7 | 165.8 | |
 U. MirBowler, 3 batted |
200.0 | 33%1/3 | -DNB | -0 balls | -DNB | 31422 (7) | 501 (2) | 331 (3) | ||||
 D. SamsAll-rounder, 4 batted |
193.2 | 100%4/4 | 23335 (15) | 22220 (9) | 15018 (12) | -DNB | 15012 (8) | |||||
 M. NaeemBatter, 7 batted |
161.6 | 43%3/7 | 12510 (8) | 1334 (3) | 501 (2) | 00 (1) | 21460 (28) | 10813 (12) | 15830 (19) | |||
|
P
P. Hossain EmonKeeper, 3 batted
|
161.4 | 33%1/3 | 23745 (19) | 10012 (12) | 10814 (13) | |||||||
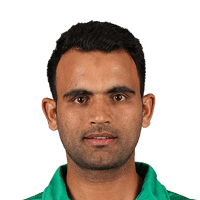 F. ZamanBatter, 8 batted |
151.9 | 63%5/8 | 12358 (47) | 14961 (41) | 202103 (51) | 15684 (54) | 18220 (11) | 11121 (19) | 501 (2) | 13653 (39) | ||
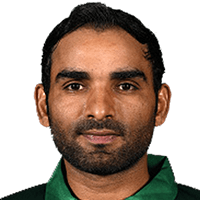 A. AliBatter, 5 batted |
143.8 | 60%3/5 | 23314 (6) | 00 (3) | 12515 (12) | 1608 (5) | 1509 (6) | |||||
 A. ShafiqueBatter, 10 batted |
142.4 | 60%6/10 | 22725 (11) | 17262 (36) | 9314 (15) | 14426 (18) | 7717 (22) | 14021 (15) | 8310 (12) | 23633 (14) | 13833 (24) | 804 (5) |
 S. RazaAll-rounder, 10 batted |
138.5 | 50%5/10 | 26429 (11) | 15018 (12) | 1005 (5) | 00 (1) | 8815 (17) | 10814 (13) | 13225 (19) | 16313 (8) | 9119 (21) | 24024 (10) |
|
M
M. FarooqBatter, 4 batted
|
126.1 | 25%1/4 | 12018 (15) | 804 (5) | 15463 (41) | 252 (8) | ||||||
 C. AsalankaAll-rounder, 5 batted |
118.3 | 0%0/5 | 12733 (26) | 00 (3) | 12931 (24) | 1001 (1) | 1006 (6) | |||||
 S. AfridiBowler, 7 batted |
108.5 | 43%3/7 | -DNB | 25010 (4) | 898 (9) | -DNB | 00 (2) | 715 (7) | 479 (19) | -0 balls | 1757 (4) | 60012 (2) |
 M. RahmanBowler, 3 batted |
100.0 | 33%1/3 | 1334 (3) | 00 (1) | -DNB | 1001 (1) | -DNB | |||||
|
H
H. KhanKeeper, 5 batted
|
98.4 | 20%1/5 | -DNB | -DNB | -DNB | 8933 (37) | 383 (8) | 8619 (22) | 9328 (30) | 14340 (28) | ||
 H. RaufBowler, 3 batted |
42.9 | 0%0/3 | -DNB | -DNB | -DNB | -DNB | 00 (1) | 672 (3) | -DNB | 404 (10) | -DNB | |
|
U
U. ShahBowler, 3 batted
|
41.7 | 0%0/3 | -DNB | -DNB | -DNB | 674 (6) | 331 (3) | -DNB | 00 (3) | -DNB | ||
 D. WellalageBowler, 1 batted |
83.3 | 0%0/1 | 8320 (24) | -DNB | ||||||||
 R. HermannKeeper, 2 batted |
35.0 | 0%0/2 | 294 (14) | 503 (6) | ||||||||
 R. BurlBatter, 1 batted |
33.3 | 0%0/1 | -DNB | 332 (6) | ||||||||

A green cell reached the line. The line under a strike rate is the runs and the balls faced; DNB did not bat.
Lahore Qalandars Team Strike rate
Line150.5
Avg146.3150.8
Hit60%
Lahore Qalandars Strike rate Match by Match
The last 10 PSL matches and how often Lahore Qalandars went over the line
Line150.5
| Opponent | Result | For | Ag | 150.5+ |
|---|---|---|---|---|
| Avg | 148.3 | 153.7 | 60% | |
 Peshawar Zalmi (H)25 Apr |
Wby 6 wickets | 170.9 | 165.8 | |
 Karachi Kings (H)23 Apr |
Lby 5 wickets | 165.8 | 181.3 | |
 Quetta Gladiators (H)21 Apr |
Wby 9 runs | 164.2 | 156.7 | |
 Rawalpindiz (H)18 Apr |
Wby 32 runs | 175.0 | 148.3 | |
| Quetta Gladiators (H)17 Apr |
Lby 6 wickets | 112.6 | 140.8 | |
| Peshawar Zalmi (A)11 Apr |
Lby 76 runs | 95.1 | 144.2 | |
 Islamabad United (H)9 Apr |
Lby 9 wickets | 90.1 | 167.7 | |
 Multan Sultans (A)3 Apr |
Wby 20 runs | 237.2 | 211.5 | |
| Karachi Kings (H)29 Mar |
Lby 4 wickets | 106.7 | 112.0 | |
 Hyderabad Kingsmen (H)26 Mar |
Wby 69 runs | 165.8 | 108.3 |
Lahore Qalandars Strike rate Lines
How often each line went over, last 10 PSL matches
| Line | Over | Under | Over % |
|---|---|---|---|
| 140.5 | 6 | 4 | 60% |
| 145.5 | 6 | 4 | 60% |
| 150.5 | 6 | 4 | 60% |
| 155.5 | 6 | 4 | 60% |
| 160.5 | 6 | 4 | 60% |
| Line | Over | Under | Over % |
|---|
Strike rate Batting First and Chasing
Lahore Qalandars's strike rate per game by when they batted
| Batting | P | W | For | Ag |
|---|---|---|---|---|
| First | 8 | 4 | 152.2 | 153.3 |
| Second | 2 | 1 | 133.0 | 155.0 |
PSL 2026 Strike rate Table
Strike rate, this season
| Side | P | For | Ag |
|---|---|---|---|
| 1Peshawar Zalmi |
11 | 167.3 | 135.1 |
| 2Multan Sultans |
11 | 166.8 | 166.2 |
| 3Islamabad United |
11 | 152.8 | 138.5 |
| 4Hyderabad Kingsmen |
13 | 146.6 | 148.1 |
| 5Karachi Kings |
10 | 146.6 | 160.4 |
| 6Lahore Qalandars |
10 | 146.3 | 150.8 |
| 7Quetta Gladiators |
10 | 144.3 | 149.5 |
| 8Rawalpindiz |
10 | 139.2 | 165.2 |
Lahore Qalandars PSL Strike rate Questions
What is Lahore Qalandars's strike rate in PSL matches?
Lahore Qalandars have scored at a strike rate of 146.3 over their last 10 PSL matches, their opponents at 150.8.
How often do Lahore Qalandars bat at a strike rate over 150.5?
Lahore Qalandars went over 150.5 in 6 of their last 10 PSL matches.
Who has the best strike rate for Lahore Qalandars?
Over Lahore Qalandars's last 10 PSL matches, batting three times or more: Usama Mir (200.0 in 3 innings), Daniel Sams (193.2 in 4 innings), Mohammad Naeem (161.6 in 7 innings).