




























Gujarat Lions Stats
Gujarat Lions IPL Cricket Economy Rate Stats
How many runs an over Gujarat Lions concede, and who bowls tightest, game by game
Updated , after the Sunrisers Hyderabad game
| Player | Avg | Hit % | ||||||||||||||||||||
|---|---|---|---|---|---|---|---|---|---|---|---|---|---|---|---|---|---|---|---|---|---|---|
| Gujarat Lions total | 9.14 | 8.70 | 10.02 | 9.45 | 12.23 | 8.42 | 7.65 | 6.70 | 9.40 | 9.35 | 10.65 | 9.08 | 8.55 | 9.03 | 12.40 | 8.43 | 8.67 | 8.60 | 6.20 | 12.40 | 7.90 | |
 A. TyeBowler, 6 bowled |
6.71 | 33%2/6 | 9.001-9-0 | 3.004-12-3 | 8.754-35-2 | 8.504-34-0 | 8.504-34-2 | 4.254-17-5 | ||||||||||||||
 A. SoniBowler, 6 bowled |
7.93 | 33%2/6 | 14.312.1-31-0 | 9.003-27-0 | 13.002-26-0 | 4.004-16-0 | 4.004-16-1 | 9.333-28-1 | ||||||||||||||
 S. RainaBatter, 7 bowled |
8.36 | 57%4/7 | -DNB | -DNB | -DNB | 12.002-24-0 | -DNB | 7.004-28-0 | -DNB | 6.001-6-0 | 5.502-11-1 | -DNB | -DNB | 9.001-9-0 | 12.002-24-0 | -DNB | 7.502-15-0 | -DNB | -DNB | -DNB | -DNB | |
 D. KulkarniBowler, 11 bowled |
8.64 | 36%4/11 | 7.504-30-1 | 6.004-24-1 | 11.502-23-0 | 9.254-37-1 | 8.502-17-0 | 14.822.5-42-0 | 8.004-32-0 | 3.504-14-4 | 10.254-41-2 | 8.504-34-1 | 11.003-33-1 | |||||||||
 D. BravoAll-rounder, 6 bowled |
8.82 | 50%3/6 | 8.004-32-2 | 8.673-26-0 | 5.504-22-2 | 7.254-29-1 | 15.333-46-0 | 9.754-39-0 | ||||||||||||||
 R. JadejaAll-rounder, 17 bowled |
8.87 | 35%6/17 | 6.333-19-0 | 7.754-31-0 | 9.502-19-0 | 14.002-28-1 | 9.502-19-0 | 11.001-11-0 | 7.004-28-2 | 8.004-32-1 | 7.754-31-0 | 14.254-57-0 | 8.504-34-0 | 10.004-40-1 | -DNB | 5.254-21-2 | 15.001-15-0 | 8.502-17-0 | 8.504-34-0 | 8.333-25-0 | ||
 P. KumarBowler, 11 bowled |
8.92 | 45%5/11 | 5.504-22-2 | 12.002-24-1 | 10.002.3-25-1 | 12.754-51-1 | 8.002-16-1 | 6.502-13-0 | 9.603.2-32-0 | 9.603.2-32-0 | 6.004-24-2 | 6.002-12-0 | 11.254-45-2 | |||||||||
 B. ThampiBowler, 12 bowled |
9.49 | 25%3/12 | 11.733.4-43-1 | 12.004-48-1 | 10.004-40-1 | 8.754-35-2 | 7.254-29-3 | 8.504-34-1 | 11.004-44-0 | 11.004-44-1 | 7.754-31-1 | 8.504-34-0 | 7.003-21-0 | 10.502-21-0 | ||||||||
 D. SmithBatter, 15 bowled |
9.74 | 27%4/15 | -DNB | 17.001-17-0 | -DNB | 11.001-11-0 | 8.673-26-0 | 18.001-18-1 | 7.002-14-0 | 17.001-17-0 | 12.001-12-0 | 5.002-10-1 | -DNB | 23.001-23-0 | 14.502-29-1 | 14.001-14-0 | 9.254-37-2 | 2.004-8-4 | 13.001-13-0 | 7.002-14-1 | ||
 J. FaulknerAll-rounder, 8 bowled |
9.80 | 13%1/8 | 12.002-24-0 | 9.754-39-2 | 10.754-43-0 | 14.002.3-35-0 | 10.592.5-30-0 | 8.504-34-2 | 5.003-15-1 | 9.504-38-1 | ||||||||||||
 S. KoushikBowler, 5 bowled |
9.83 | 40%2/5 | 12.003-36-0 | 7.254-29-0 | 10.004-40-0 | 5.504-22-2 | 16.673-50-0 | |||||||||||||||
 S. JakatiBowler, 5 bowled |
9.93 | 20%1/5 | 11.002-22-0 | 10.003-30-0 | 15.003-45-0 | 10.003-30-0 | 5.504-22-1 | |||||||||||||||
 P. SangwanBowler, 5 bowled |
10.06 | 0%0/5 | 9.254-37-0 | 11.673-35-1 | 9.333-28-1 | 10.754-43-1 | 9.504-38-2 | |||||||||||||||
 N. SinghBowler, 2 bowled |
3.75 | 100%2/2 | 4.002-8-0 | 3.502-7-1 | ||||||||||||||||||
 S. AravindBowler, 1 bowled |
4.33 | 100%1/1 | 4.333-13-0 | |||||||||||||||||||
 K. YadavBowler, 1 bowled |
6.25 | 100%1/1 | 6.254-25-2 | |||||||||||||||||||
 C. JordanBowler, 1 bowled |
6.50 | 100%1/1 | 6.504-26-2 | |||||||||||||||||||
 B. KumarBowler, 1 bowled |
6.75 | 100%1/1 | 6.754-27-2 | |||||||||||||||||||
 M. PatelBowler, 2 bowled |
8.14 | 50%1/2 | 7.333-22-0 | 8.754-35-1 | ||||||||||||||||||
 P. ChawlaAll-rounder, 1 bowled |
8.25 | 0%0/1 | 8.254-33-1 | |||||||||||||||||||
 S. NarineBowler, 1 bowled |
8.25 | 0%0/1 | 8.254-33-0 | |||||||||||||||||||
 B. SranBowler, 1 bowled |
9.33 | 0%0/1 | 9.333-28-0 | |||||||||||||||||||
 T. BarokaBowler, 1 bowled |
9.43 | 0%0/1 | 9.433.3-33-0 | |||||||||||||||||||
 T. BoultBowler, 2 bowled |
9.88 | 0%0/2 | 10.004-40-1 | 9.754-39-1 | ||||||||||||||||||
 S. AgarwalBowler, 1 bowled |
10.50 | 0%0/1 | 10.504-42-1 | |||||||||||||||||||
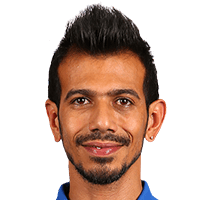 Y. ChahalBowler, 1 bowled |
10.50 | 0%0/1 | 10.504-42-1 | |||||||||||||||||||
 C. WoakesAll-rounder, 1 bowled |
11.67 | 0%0/1 | 11.673-35-0 | |||||||||||||||||||
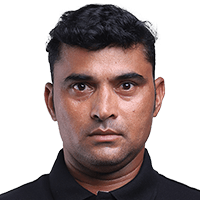 P. TambeBowler, 1 bowled |
12.50 | 0%0/1 | 12.502-25-0 | |||||||||||||||||||
 I. PathanBowler, 1 bowled |
13.00 | 0%0/1 | 13.002-26-0 | |||||||||||||||||||
 Y. PathanAll-rounder, 1 bowled |
15.00 | 0%0/1 | 15.001-15-0 | |||||||||||||||||||
 M. GonyBowler, 1 bowled |
16.00 | 0%0/1 | 16.002-32-0 | |||||||||||||||||||

 A
Gujarat Lions Team Economy
Gujarat Lions Economy Match by Match
The last 20 IPL matches and how often Gujarat Lions kept under the line
Gujarat Lions Economy Lines
How often they kept under each line, last 20 IPL matches
| Line | Over | Under | Under % |
|---|---|---|---|
| 8 | 16 | 4 | 20% |
| 8.5 | 14 | 6 | 30% |
| 9 | 10 | 10 | 50% |
| 9.5 | 5 | 15 | 75% |
| 10 | 5 | 15 | 75% |
| Line | Over | Under | Under % |
|---|
Economy Batting First and Chasing
Gujarat Lions's economy rate per game by when they batted
| Batting | P | W | For | Ag |
|---|---|---|---|---|
| First | 10 | 0 | 9.46 | 8.46 |
| Second | 10 | 7 | 8.92 | 9.07 |
IPL 2026 Economy Table
Economy rate, this season
| Side | P | For | Ag |
|---|---|---|---|
1 Kolkata Knight Riders |
13 | 9.28 | 9.29 |
2 Royal Challengers Bengaluru |
16 | 9.51 | 10.48 |
3 Gujarat Titans |
17 | 9.56 | 9.53 |
4 Chennai Super Kings |
14 | 9.58 | 9.44 |
5 Lucknow Super Giants |
14 | 9.87 | 9.23 |
6 Rajasthan Royals |
16 | 10.10 | 10.42 |
7 Sunrisers Hyderabad |
15 | 10.14 | 10.54 |
8 Delhi Capitals |
14 | 10.14 | 9.51 |
9 Mumbai Indians |
14 | 10.25 | 9.54 |
10 Punjab Kings |
13 | 10.53 | 10.84 |
Gujarat Lions IPL Economy Questions
What is Gujarat Lions's economy rate in IPL matches?
Gujarat Lions's bowlers have conceded 9.14 runs an over over their last 20 IPL matches, since May 2016, giving away 3,496 runs in 382.7 overs, while Gujarat Lions have scored at 8.73 an over against them.
How often do Gujarat Lions concede under 9 an over?
Gujarat Lions conceded under 9 an over in 10 of their last 20 IPL matches, since May 2016, 50% of the time, with an economy rate of 9.14 across those games.
Who is Gujarat Lions's most economical bowler?
Andrew Tye is Gujarat Lions's most economical bowler over their last 20 IPL matches, since May 2016, at 6.71 an over in 6 spells among those bowling three times or more, ahead of Ankit Soni (7.93) and Suresh Raina (8.36).