





























Afghanistan Stats
Afghanistan ODI Cricket Performance Points Stats
How many performance points Afghanistan score, and who scores the most, game by game
Updated , after the Ireland game
| Player | Avg | Hit % | ||||||||||
|---|---|---|---|---|---|---|---|---|---|---|---|---|
| Afghanistan total | 438 | 510 | 430 | 487 | 594 | 359 | 424 | 352 | 478 | 226 | 519 | |
 I. ZadranBatter, 5 played |
87.4 | 60%3/5 | 95 | 105 | 33 | 187 | 17 | |||||
 A. OmarzaiAll-rounder, 10 played |
69.7 | 70%7/10 | 40 | 60 | 100 | 151 | 48 | 150 | 10 | 30 | 2 | 106 |
 R. KhanBowler, 9 played |
58.7 | 67%6/9 | 68 | 111 | 70 | 21 | 28 | 20 | 54 | 50 | 106 | |
 R. GurbazKeeper, 10 played |
55.1 | 50%5/10 | 52 | 36 | 95 | 26 | 20 | 121 | 2 | 5 | 89 | 105 |
 M. NabiAll-rounder, 10 played |
52.6 | 50%5/10 | 72 | 22 | 21 | 110 | 48 | 54 | 37 | 104 | 25 | 33 |
|
N
N. KharotiAll-rounder, 5 played
|
36.2 | 40%2/5 | 10 | 64 | 27 | 0 | 80 | |||||
 A. GhazanfarBowler, 8 played |
34.3 | 50%4/8 | 0 | 22 | 40 | 0 | 41 | 120 | 51 | 0 | ||
 R. ShahAll-rounder, 9 played |
32.9 | 44%4/9 | 9 | 50 | 14 | 100 | 18 | 52 | 2 | 1 | 50 | |
|
N
N. KharoteAll-rounder, 3 played
|
24.3 | 0%0/3 | 20 | 33 | 20 | |||||||
 H. ShahidiBatter, 9 played |
23.8 | 33%3/9 | 2 | 4 | 53 | 40 | 10 | 16 | 17 | 62 | 10 | |
 G. NaibAll-rounder, 5 played |
20.6 | 0%0/5 | 21 | 13 | 21 | 26 | 22 | |||||
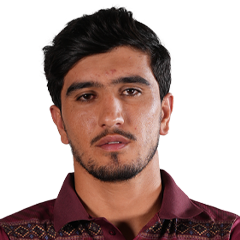 S. AtalBatter, 8 played |
19.5 | 13%1/8 | 29 | 8 | 5 | 4 | 26 | 14 | 49 | 21 | ||
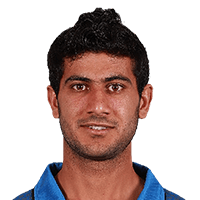 I. AlikhilKeeper, 4 played |
17.8 | 0%0/4 | 22 | 25 | 14 | 10 | ||||||
 F. FarooqiBowler, 6 played |
8.3 | 0%0/6 | 20 | 20 | 0 | 0 | 10 | 0 | ||||
 B. SamiBowler, 1 played |
110 | 100%1/1 | 110 | |||||||||
|
R
R. HassanBatter, 1 played
|
29.0 | 0%0/1 | 29 | |||||||||
 F. AhmadBowler, 1 played |
24.0 | 0%0/1 | 24 | |||||||||
 N. AhmadBowler, 2 played |
14.5 | 0%0/2 | 0 | 29 | ||||||||
|
B
B. AhmadBowler, 2 played
|
10.0 | 0%0/2 | 20 | 0 | ||||||||
 A. MalikAll-rounder, 1 played |
9.0 | 0%0/1 | 9 | |||||||||
|
N
N. ZadranAll-rounder, 1 played
|
1.00 | 0%0/1 | 1 | |||||||||
Afghanistan Team Performance
Afghanistan Performance Match by Match
The last 10 ODIs and how often Afghanistan went over the line
| Opponent | Result | For | Ag | Total | 425.5+ |
|---|---|---|---|---|---|
| Avg | 438 | 391 | 829 | 60% | |
 Bangladesh (H)ODI, 14 Oct 2025 |
Wby 200 runs | 510 | 288 | 798 | |
| Bangladesh (H)ODI, 11 Oct 2025 |
Wby 81 runs | 430 | 340 | 770 | |
| Bangladesh (H)ODI, 8 Oct 2025 |
Wby 5 wickets | 487 | 363 | 850 | |
 England (H)CT, 26 Feb 2025 |
Wby 8 runs | 594 | 485 | 1079 | |
 South Africa (H)CT, 21 Feb 2025 |
Lby 107 runs | 359 | 562 | 921 | |
| Bangladesh (H)ODI, 11 Nov 2024 |
Wby 5 wickets | 424 | 366 | 790 | |
| Bangladesh (H)ODI, 9 Nov 2024 |
Lby 68 runs | 352 | 508 | 860 | |
| Bangladesh (H)ODI, 6 Nov 2024 |
Wby 92 runs | 478 | 390 | 868 | |
| South Africa (H)ODI, 22 Sep 2024 |
Lby 7 wickets | 226 | 371 | 597 | |
| South Africa (H)ODI, 20 Sep 2024 |
Wby 177 runs | 519 | 240 | 759 |
Pakistan Performance Match by Match
Afghanistan's next opponent, their last 10 ODIs
| Opponent | Result | For | Ag | Total |
|---|---|---|---|---|
| Avg | 413 | 357 | 770 | |
 Australia (H)4 Jun |
Wby 4 wickets | 402 | 284 | 686 |
| Australia (H)2 Jun |
Lby 41 runs | 400 | 463 | 863 |
| Australia (H)30 May |
Wby 5 wickets | 450 | 307 | 757 |
| Bangladesh (H)15 Mar |
Lby 11 runs | 390 | 539 | 929 |
| Bangladesh (H)13 Mar |
Wby 128 runs | 520 | 371 | 891 |
| Bangladesh (H)11 Mar |
Lby 8 wickets | 169 | 381 | 550 |
 Sri Lanka (H)16 Nov 2025 |
Wby 6 wickets | 428 | 299 | 727 |
| Sri Lanka (H)14 Nov 2025 |
Wby 8 wickets | 469 | 325 | 794 |
| Sri Lanka (H)11 Nov 2025 |
Wby 6 runs | 530 | 387 | 917 |
| South Africa (H)8 Nov 2025 |
Wby 7 wickets | 371 | 210 | 581 |
Afghanistan Performance Lines
How often each line went over, last 10 ODIs
| Line | Over | Under | Over % |
|---|---|---|---|
| 375.5 | 7 | 3 | 70% |
| 400.5 | 7 | 3 | 70% |
| 425.5 | 6 | 4 | 60% |
| 450.5 | 5 | 5 | 50% |
| 475.5 | 5 | 5 | 50% |
| Line | Over | Under | Over % |
|---|---|---|---|
| 775.5 | 7 | 3 | 70% |
| 800.5 | 5 | 5 | 50% |
| 825.5 | 5 | 5 | 50% |
| 850.5 | 4 | 6 | 40% |
| 875.5 | 2 | 8 | 20% |
Performance Batting First and Chasing
Afghanistan's performance points per game by when they batted
| Batting | P | W | For | Ag |
|---|---|---|---|---|
| First | 6 | 5 | 460 | 352 |
| Second | 4 | 2 | 406 | 450 |
ODI Performance Table
Performance points per game, sides with 8+ ODIs in the last two years
| Side | P | For | Ag | Match |
|---|---|---|---|---|
1 India |
28 | 481 | 410 | 891 |
| 2England |
24 | 463 | 457 | 920 |
| 3South Africa |
24 | 460 | 451 | 911 |
| 4Afghanistan |
14 | 449 | 407 | 856 |
5 New Zealand |
32 | 447 | 410 | 858 |
| 6Sri Lanka |
22 | 435 | 444 | 879 |
| 7Australia |
22 | 430 | 453 | 883 |
8 Pakistan |
26 | 419 | 419 | 838 |
9 Ireland |
14 | 414 | 461 | 875 |
| 10Bangladesh |
26 | 414 | 424 | 838 |
11 West Indies |
26 | 409 | 448 | 857 |
12 Namibia |
8 | 386 | 457 | 843 |
13 Zimbabwe |
16 | 370 | 430 | 800 |
Afghanistan Performance by Competition
Performance points per game in each ODI competition
| Competition | P | W-L | For | Ag |
|---|---|---|---|---|
 One Day Internationals | 8 | 6-2 | 428 | 358 |
 ICC Champions Trophy | 2 | 1-1 | 477 | 524 |
Afghanistan ODI Performance Questions
How many performance points do Afghanistan score per ODI?
Afghanistan have averaged 438 performance points per ODI over their last 10 ODIs, since September 2024, against their opponents' 391, with 829 in the match between them, and their best was 594 against England on 26 Feb 2025.
How often do Afghanistan go over 425.5 performance points?
Afghanistan went over 425.5 performance points in 6 of their last 10 ODIs, since September 2024, 60% of the time, while averaging 438 per ODI against their opponents' 391, and made 510 in their latest, against Bangladesh.
Who scores the most performance points for Afghanistan?
Azmatullah Omarzai scores the most performance points for Afghanistan over their last 10 ODIs, since September 2024, with 697 in 10 games at 69.7 a game, ahead of Rahmanullah Gurbaz (551) and Rashid Khan (528).
What is Afghanistan's highest performance points in a recent ODI?
Afghanistan's highest over their last 10 ODIs, since September 2024, is 594 performance points against England on 26 Feb 2025 at Gaddafi Stadium, Lahore, against their average of 438.
Do Afghanistan score more performance points batting first or chasing?
Batting first brings Afghanistan more performance points over their last 10 ODIs, since September 2024: they average 460 performance points batting first in 6 ODIs, and 406 batting second in 4, a gap of 54.0 performance points.