






South Africa Stats
South Africa ODI Strike Rate Stats
How fast South Africa score, and who bats quickest, game by game
Updated 30 September 2026, after the Australia game
| Player | Avg | Hit % | ||||||||||
|---|---|---|---|---|---|---|---|---|---|---|---|---|
| South Africa total | 93.7 | 86.3 | 121.7 | 99.0 | 103.4 | 107.5 | 95.8 | 79.7 | 79.3 | 84.3 | 70.3 | |
 H. KlaasenKeeper, 6 batted |
117.9 | 67%4/6 | 11464 (56) | 18881 (43) | 13197 (74) | 8986 (97) | 9621 (22) | -DNB | 676 (9) | |||
 D. MillerBatter, 7 batted |
105.2 | 29%2/7 | 153142 (93) | 369 (25) | 3507 (2) | 503 (6) | 7429 (39) | 5010 (20) | -DNB | 292 (7) | ||
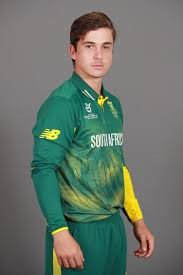 M. BreetzkeBatter, 3 batted |
104.9 | 67%2/3 | 8625 (29) | 12134 (28) | 106112 (106) | |||||||
 M. JansenAll-rounder, 5 batted |
103.1 | 60%3/5 | 12719 (15) | 12775 (59) | -DNB | 11826 (22) | 503 (6) | 3710 (27) | ||||
 T. de ZorziBatter, 7 batted |
98.5 | 71%5/7 | 00 (7) | 11326 (23) | 8534 (40) | 13233 (25) | 9381 (87) | 98119 (122) | 12728 (22) | |||
 R. RickeltonKeeper, 4 batted |
94.7 | 75%3/4 | 8871 (81) | 10427 (26) | 10827 (25) | -DNB | 9536 (38) | |||||
 C. BoschAll-rounder, 3 batted |
88.6 | 67%2/3 | 6513 (20) | 1509 (6) | 9140 (44) | |||||||
 T. BavumaBatter, 4 batted |
81.8 | 25%1/4 | 89103 (116) | 6330 (48) | 1338 (6) | 7112 (17) | ||||||
 Q. de KockKeeper, 3 batted |
80.6 | 33%1/3 | 00 (5) | 11515 (13) | 7814 (18) | |||||||
 A. MarkramBatter, 8 batted |
72.9 | 25%2/8 | 9415 (16) | 00 (1) | -DNB | 7019 (27) | 7021 (30) | 6535 (54) | 8836 (41) | 1002 (2) | 5712 (21) | |
 R. van der DussenBatter, 7 batted |
69.8 | 0%0/7 | 8372 (87) | 6735 (52) | 7723 (30) | 578 (14) | 122 (17) | 7136 (51) | 00 (1) | |||
 T. StubbsKeeper, 4 batted |
65.6 | 0%0/4 | 8214 (17) | 756 (8) | 00 (5) | 501 (2) | ||||||
 B. FortuinBowler, 4 batted |
63.9 | 50%2/4 | -DNB | 1005 (5) | 1001 (1) | 508 (16) | 649 (14) | |||||
 R. HendricksBatter, 3 batted |
62.8 | 0%0/3 | 7919 (24) | 6452 (81) | 00 (8) | |||||||
 K. MaharajBowler, 3 batted |
61.1 | 33%1/3 | 2004 (2) | -DNB | -DNB | 5214 (27) | -DNB | 574 (7) | ||||
 A. PhehlukwayoAll-rounder, 3 batted |
58.3 | 0%0/3 | 171 (6) | 201 (5) | 6733 (49) | |||||||
 G. CoetzeeAll-rounder, 1 batted |
150.0 | 100%1/1 | -DNB | 1506 (4) | ||||||||
 D. JansenBowler, 1 batted |
150.0 | 100%1/1 | 15027 (18) | |||||||||
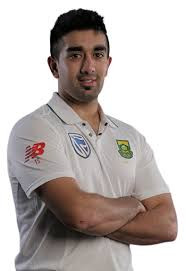 T. ShamsiBowler, 2 batted |
120.0 | 50%1/2 | 501 (2) | -DNB | 13811 (8) | |||||||
 L. WilliamsBowler, 2 batted |
75.0 | 50%1/2 | -DNB | 1001 (1) | 672 (3) | -DNB | ||||||
 K. RabadaBowler, 2 batted |
71.4 | 50%1/2 | -DNB | 10814 (13) | 5011 (22) | |||||||
 B. HendricksBowler, 1 batted |
69.2 | 0%0/1 | 6918 (26) | -DNB | ||||||||
 O. BaartmanBowler, 1 batted |
62.5 | 0%0/1 | 6310 (16) | |||||||||
 K. MaphakaBowler, 2 batted |
33.3 | 0%0/2 | 00 (1) | 501 (2) | ||||||||
 W. MulderAll-rounder, 2 batted |
25.0 | 0%0/2 | -DNB | 331 (3) | -DNB | 00 (1) | ||||||
 N. BurgerBowler, 2 batted |
20.5 | 0%0/2 | 141 (7) | -DNB | 227 (32) | |||||||
South Africa Team Strike rate
South Africa Strike rate Match by Match
The last 10 ODIs and how often South Africa went over the line
| Opponent | Result | For | Ag | 90.5+ |
|---|---|---|---|---|
| Avg | 92.7 | 98.2 | 50% | |
 Australia (H)ODI, 30 Sep |
Lby 47 runs | 86.3 | 107.3 | |
| Australia (H)ODI, 27 Sep |
Wby 32 runs | 121.7 | 111.4 | |
| Australia (H)ODI, 24 Sep |
Wby 67 runs | 99.0 | 92.7 | |
 England (H)CT, 1 Mar 2025 |
Wby 7 wickets | 103.4 | 77.8 | |
 Pakistan (H)ODI, 22 Dec 2024 |
Lby 36 runs | 107.5 | 109.2 | |
| Pakistan (H)ODI, 19 Dec 2024 |
Lby 81 runs | 95.8 | 110.0 | |
| Pakistan (H)ODI, 17 Dec 2024 |
Lby 3 wickets | 79.7 | 81.5 | |
 India (H)ODI, 21 Dec 2023 |
Lby 78 runs | 79.3 | 98.7 | |
| India (H)ODI, 19 Dec 2023 |
Wby 8 wickets | 84.3 | 75.9 | |
| India (H)ODI, 17 Dec 2023 |
Lby 8 wickets | 70.3 | 117.0 |
Bangladesh Strike rate Match by Match
South Africa's next opponent, their last 10 ODIs
| Opponent | Result | For | Ag |
|---|---|---|---|
| Avg | 86.5 | 77.9 | |
 Zimbabwe (A)11 Jul |
Wby 7 wickets | 92.6 | 68.9 |
| Zimbabwe (A)9 Jul |
Lby 13 runs | 81.0 | 82.3 |
| Zimbabwe (A)6 Jul |
Lby 25 runs | 58.3 | 64.1 |
| Australia (H)14 Jun |
Lby 1 wicket | 91.3 | 93.3 |
| Australia (H)11 Jun |
Wby 5 wickets | 92.9 | 74.2 |
| Australia (H)9 Jun |
Wby 86 runs | 94.7 | 75.2 |
 New Zealand (H)23 Apr |
Wby 55 runs | 88.3 | 78.1 |
| New Zealand (H)20 Apr |
Wby 6 wickets | 93.4 | 67.8 |
| New Zealand (H)17 Apr |
Lby 26 runs | 75.9 | 82.3 |
| Pakistan (A)15 Mar |
Wby 11 runs | 96.7 | 93.0 |
South Africa Strike rate Lines
How often each line went over, last 10 ODIs
| Line | Over | Under | Over % |
|---|---|---|---|
| 80.5 | 7 | 3 | 70% |
| 85.5 | 6 | 4 | 60% |
| 90.5 | 5 | 5 | 50% |
| 95.5 | 5 | 5 | 50% |
| 100.5 | 3 | 7 | 30% |
| Line | Over | Under | Over % |
|---|
Strike rate Batting First and Chasing
South Africa's strike rate per game by when they batted
| Batting | P | W | For | Ag |
|---|---|---|---|---|
| First | 4 | 2 | 92.7 | 100.7 |
| Second | 6 | 2 | 92.8 | 96.5 |
ODI Strike rate Table
Strike rate, sides with 8+ ODIs in the last two years
| Side | P | For | Ag |
|---|---|---|---|
| 1India |
28 | 106.9 | 96.7 |
| 2England |
24 | 104.3 | 100.9 |
| 3South Africa |
24 | 101.7 | 101.2 |
4 West Indies |
26 | 96.2 | 97.9 |
| 5Australia |
22 | 93.8 | 92.5 |
6 Afghanistan |
15 | 92.7 | 94.9 |
| 7New Zealand |
32 | 91.0 | 88.8 |
8 Ireland |
14 | 90.7 | 98.2 |
9 Sri Lanka |
22 | 89.7 | 93.7 |
| 10Pakistan |
26 | 88.6 | 91.5 |
11 Namibia |
8 | 86.5 | 98.0 |
12 Bangladesh |
27 | 85.0 | 83.3 |
| 13Zimbabwe |
16 | 85.0 | 91.4 |
South Africa Strike rate by Competition
Strike rate per game in each ODI competition
| Competition | P | W-L | For | Ag |
|---|---|---|---|---|
 One Day Internationals | 9 | 3-6 | 91.5 | 100.4 |
 ICC Champions Trophy | 1 | 1-0 | 103.4 | 77.8 |
South Africa ODI Strike rate Questions
What is South Africa's strike rate in ODIs?
South Africa have scored at a strike rate of 93.7 over their last 10 ODIs, their opponents at 97.5.
How often do South Africa bat at a strike rate over 90.5?
South Africa went over 90.5 in 5 of their last 10 ODIs.
Who has the best strike rate for South Africa?
Over South Africa's last 10 ODIs, batting three times or more: Heinrich Klaasen (117.9 in 6 innings), David Miller (105.2 in 7 innings), Matthew Breetzke (104.9 in 3 innings).