






South Africa Stats
South Africa ODI Strike Rate Stats
How fast South Africa score, and who bats quickest, game by game
Updated 30 September 2026, after the Australia game
| Player | Avg | Hit % | ||||||||||
|---|---|---|---|---|---|---|---|---|---|---|---|---|
| South Africa total | 102.2 | 121.7 | 111.7 | 116.0 | 94.1 | 122.3 | 112.2 | 63.0 | 112.0 | 89.2 | 57.6 | |
 M. JansenAll-rounder, 3 batted |
158.9 | 100%3/3 | 11317 (15) | 1002 (2) | 18070 (39) | |||||||
 D. BrevisBatter, 7 batted |
123.9 | 86%6/7 | 3006 (2) | 12337 (30) | 11833 (28) | 10029 (29) | 15954 (34) | 13237 (28) | 506 (12) | |||
 J. HermannBatter, 3 batted |
118.2 | 67%2/3 | 13177 (59) | 8320 (24) | 119150 (126) | |||||||
 C. BoschAll-rounder, 7 batted |
117.1 | 57%4/7 | -DNB | 16339 (24) | 759 (12) | 19329 (15) | 13167 (51) | 00 (1) | -DNB | 10341 (40) | 6320 (32) | |
 A. MarkramBatter, 4 batted |
100.0 | 25%1/4 | 331 (3) | 112110 (98) | 477 (15) | 00 (2) | ||||||
 C. EsterhuizenKeeper, 3 batted |
100.0 | 67%2/3 | 10068 (68) | 108119 (110) | 5310 (19) | |||||||
 L. PretoriusKeeper, 3 batted |
97.9 | 67%2/3 | 8739 (45) | 11546 (40) | 9557 (60) | |||||||
 Q. de KockKeeper, 6 batted |
97.5 | 33%2/6 | 119106 (89) | 738 (11) | 00 (2) | 7653 (70) | 103123 (119) | 8963 (71) | ||||
 T. de ZorziBatter, 7 batted |
96.5 | 71%5/7 | 9179 (87) | 8672 (84) | 15517 (11) | 11139 (35) | 142 (14) | 12176 (63) | 9018 (20) | |||
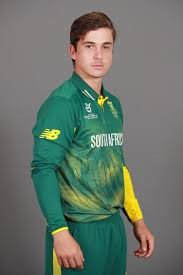 M. BreetzkeBatter, 8 batted |
84.6 | 38%3/8 | 804 (5) | 10424 (23) | 10668 (64) | 9072 (80) | 4616 (35) | 8117 (21) | 7842 (54) | 404 (10) | ||
 K. MaharajBowler, 3 batted |
78.3 | 33%1/3 | 6920 (29) | 7110 (14) | 10017 (17) | |||||||
 N. BurgerBowler, 3 batted |
52.4 | 0%0/3 | -DNB | 7417 (23) | 253 (12) | -DNB | 292 (7) | |||||
 R. RickeltonKeeper, 3 batted |
10.0 | 0%0/3 | 00 (4) | 00 (1) | 201 (5) | |||||||
 L. NgidiBowler, 3 batted |
6.3 | 0%0/3 | 101 (10) | -DNB | 00 (1) | 00 (5) | ||||||
|
N
N. MokoenaBatter, 1 batted
|
233.3 | 100%1/1 | -DNB | 2337 (3) | ||||||||
 E. BoschBowler, 1 batted |
223.1 | 100%1/1 | -DNB | 22329 (13) | ||||||||
 R. HermannKeeper, 2 batted |
112.5 | 50%1/2 | -DNB | 1338 (6) | 501 (2) | |||||||
 P. SubrayenAll-rounder, 2 batted |
105.0 | 100%2/2 | 1004 (4) | -DNB | 10617 (16) | |||||||
 D. JansenBowler, 2 batted |
100.0 | 100%2/2 | 1002 (2) | 1001 (1) | ||||||||
 J. SmithBatter, 2 batted |
97.1 | 50%1/2 | 8618 (21) | 11515 (13) | ||||||||
 S. QeshileBatter, 1 batted |
95.7 | 100%1/1 | 9622 (23) | |||||||||
 T. BavumaBatter, 2 batted |
81.7 | 50%1/2 | 7248 (67) | 9646 (48) | -0 balls | |||||||
|
N
N. PeterBowler, 1 batted
|
51.6 | 0%0/1 | 5216 (31) | -DNB | ||||||||
 B. FortuinBowler, 2 batted |
50.0 | 0%0/2 | -DNB | -DNB | 603 (5) | -DNB | 00 (1) | |||||
|
N
N. PeterBowler, 1 batted
|
50.0 | 0%0/1 | -DNB | 501 (2) | ||||||||
 D. FerreiraKeeper, 2 batted |
45.5 | 0%0/2 | 647 (11) | -DNB | 273 (11) | |||||||
 T. StubbsKeeper, 1 batted |
45.5 | 0%0/1 | 4610 (22) | |||||||||
|
C
C. YusufAll-rounder, 1 batted
|
45.5 | 0%0/1 | 465 (11) | |||||||||
 L. WilliamsBowler, 1 batted |
33.3 | 0%0/1 | 331 (3) | |||||||||
 O. BaartmanBowler, 2 batted |
23.1 | 0%0/2 | 433 (7) | 00 (6) | ||||||||
 G. LindeAll-rounder, 1 batted |
22.2 | 0%0/1 | -DNB | 222 (9) | ||||||||
 W. MulderAll-rounder, 1 batted |
0.0 | 0%0/1 | 00 (7) | |||||||||

A green cell reached the line. The line under a strike rate is the runs and the balls faced; DNB did not bat.
South Africa Team Strike rate
Line100.5
Avg102.2100.9
Hit60%
South Africa Strike rate Match by Match
The last 10 ODIs and how often South Africa went over the line
Line100.5
| Opponent | Result | For | Ag | 100.5+ |
|---|---|---|---|---|
| Avg | 100.0 | 99.0 | 60% | |
 Namibia (A)13 Sep |
Wby 9 wickets | 121.7 | 71.6 | |
| Namibia (A)11 Sep |
Wby 157 runs | 111.7 | 70.9 | |
| Namibia (A)9 Sep |
Wby 99 runs | 116.0 | 87.1 | |
 India (A)6 Dec 2025 |
Lby 9 wickets | 94.1 | 113.4 | |
| India (A)3 Dec 2025 |
Wby 4 wickets | 122.3 | 119.3 | |
| India (A)30 Nov 2025 |
Lby 17 runs | 112.2 | 116.3 | |
 Pakistan (A)8 Nov 2025 |
Lby 7 wickets | 63.0 | 95.4 | |
| Pakistan (A)6 Nov 2025 |
Wby 8 wickets | 112.0 | 89.7 | |
| Pakistan (A)4 Nov 2025 |
Lby 2 wickets | 89.2 | 88.6 | |
 England (A)7 Sep 2025 |
Lby 342 runs | 57.6 | 138.0 |
Bangladesh Strike rate Match by Match
South Africa's next opponent, their last 10 ODIs
| Opponent | Result | For | Ag |
|---|---|---|---|
| Avg | 86.5 | 77.9 | |
 Zimbabwe (A)11 Jul |
Wby 7 wickets | 92.6 | 68.9 |
| Zimbabwe (A)9 Jul |
Lby 13 runs | 81.0 | 82.3 |
| Zimbabwe (A)6 Jul |
Lby 25 runs | 58.3 | 64.1 |
 Australia (H)14 Jun |
Lby 1 wicket | 91.3 | 93.3 |
| Australia (H)11 Jun |
Wby 5 wickets | 92.9 | 74.2 |
| Australia (H)9 Jun |
Wby 86 runs | 94.7 | 75.2 |
 New Zealand (H)23 Apr |
Wby 55 runs | 88.3 | 78.1 |
| New Zealand (H)20 Apr |
Wby 6 wickets | 93.4 | 67.8 |
| New Zealand (H)17 Apr |
Lby 26 runs | 75.9 | 82.3 |
| Pakistan (A)15 Mar |
Wby 11 runs | 96.7 | 93.0 |
South Africa Strike rate Lines
How often each line went over, last 10 ODIs
| Line | Over | Under | Over % |
|---|---|---|---|
| 90.5 | 7 | 3 | 70% |
| 95.5 | 6 | 4 | 60% |
| 100.5 | 6 | 4 | 60% |
| 105.5 | 6 | 4 | 60% |
| 110.5 | 6 | 4 | 60% |
| Line | Over | Under | Over % |
|---|
Strike rate Batting First and Chasing
South Africa's strike rate per game by when they batted
| Batting | P | W | For | Ag |
|---|---|---|---|---|
| First | 5 | 2 | 94.8 | 91.1 |
| Second | 5 | 3 | 105.2 | 107.0 |
ODI Strike rate Table
Strike rate, sides with 8+ ODIs in the last two years
| Side | P | For | Ag |
|---|---|---|---|
| 1India |
28 | 106.9 | 96.7 |
| 2England |
24 | 104.3 | 100.9 |
| 3South Africa |
24 | 101.7 | 101.2 |
4 West Indies |
26 | 96.2 | 97.9 |
| 5Australia |
22 | 93.8 | 92.5 |
6 Afghanistan |
15 | 92.7 | 94.9 |
| 7New Zealand |
32 | 91.0 | 88.8 |
8 Ireland |
14 | 90.7 | 98.2 |
9 Sri Lanka |
22 | 89.7 | 93.7 |
| 10Pakistan |
26 | 88.6 | 91.5 |
| 11Namibia |
8 | 86.5 | 98.0 |
12 Bangladesh |
27 | 85.0 | 83.3 |
| 13Zimbabwe |
16 | 85.0 | 91.4 |
South Africa ODI Strike rate Questions
What is South Africa's strike rate in ODIs?
South Africa have scored at a strike rate of 102.2 over their last 10 ODIs, their opponents at 100.9.
How often do South Africa bat at a strike rate over 100.5?
South Africa went over 100.5 in 6 of their last 10 ODIs.
Who has the best strike rate for South Africa?
Over South Africa's last 10 ODIs, batting three times or more: Marco Jansen (158.9 in 3 innings), Dewald Brevis (123.9 in 7 innings), Jordan Hermann (118.2 in 3 innings).