





West Indies vs India Player Ratings · One Day Internationals 2019
 West Indies
240/7
35 ov
West Indies
240/7
35 ov
Statz Rating
A contextual performance score measuring each player's overall impact in the match. Scaled against the season so ratings are directly comparable across fixtures.
| Rank | Player | Rating |
|---|---|---|
| 1 |

Chris Gayle
WI
|
76.3 |
| 2 |

Fabian Allen
WI
|
69.4 |
| 3 |

Shreyas Iyer
IND
|
65.7 |
| 4 |

Virat Kohli
IND
|
63.3 |
| 5 |

Yuzvendra Chahal
IND
|
54.7 |
| 6 |

Mohammed Shami
IND
|
52.5 |
| 7 |
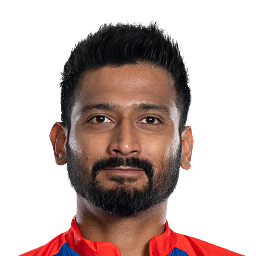
Khaleel Ahmed
IND
|
51.5 |
| 8 |

Evin Lewis
WI
|
50.1 |
| 9 |

Kedar Jadhav
IND
|
48.0 |
| 10 |

Nicholas Pooran
WI
|
45.0 |
| 11 |

Ravindra Jadeja
IND
|
40.7 |
| 12 |
Kemar Roach
WI
|
34.1 |
| 13 |

Carlos Brathwaite
WI
|
24.8 |
| 14 |
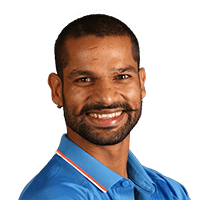
Shikhar Dhawan
IND
|
24.7 |
| 15 |

Jason Holder
WI
|
17.3 |
| 16 |

Shimron Hetmyer
WI
|
16.1 |
| 17 |

Rohit Sharma
IND
|
14.8 |
| 18 |

Roston Chase
WI
|
14.0 |
| 19 |

Shai Hope
WI
|
11.9 |
| 20 |

Keemo Paul
WI
|
9.3 |
| 21 |

Bhuvneshwar Kumar
IND
|
6.6 |
| 22 |

Rishabh Pant
IND
|
0.0 |
How Statz Rating works:
- Each player receives a contextual match impact score based on their all-round contribution — batting, bowling, and situational factors.
- Ratings are scaled against the season benchmark so they are directly comparable across fixtures and to the season leaderboard.
- A typical top performer scores around 100. Exceptional performances can exceed 100.

West Indies vs India: result and key facts
India won by 6 wickets (with 15 balls remaining) (D/L method) in One Day Internationals 2019 at Queen's Park Oval on 14 August 2019. Virat Kohli top-scored with 114 off 99 balls and Khaleel Ahmed took 3/68.
Frequently asked questions
Who won West Indies vs India?
India won by 6 wickets (with 15 balls remaining) (D/L method).
When and where was West Indies vs India played?
West Indies vs India was played at Queen's Park Oval, Port of Spain on Wednesday 14 August 2019, in One Day Internationals 2019.
What were the final scores in West Indies vs India?
West Indies scored 240/7 in 35 overs. India scored 256/4 in 32.3 overs.
Who was the Statz MVP in West Indies vs India?
Chris Gayle was named Statz MVP, earning a Statz Rating of 76/100. The Statz Rating combines batting impact, bowling impact and match context.
Who was the top run-scorer in West Indies vs India?
Virat Kohli top-scored with 114 off 99 balls.
Who took the most wickets in West Indies vs India?
Khaleel Ahmed took 3/68 in 7 overs.
Who played in West Indies vs India?
West Indies XI: Chris Gayle, Evin Lewis, Shai Hope (wk), Shimron Hetmyer, Nicholas Pooran, Jason Holder (c), Carlos Brathwaite, Fabian Allen, Keemo Paul, Roston Chase, Kemar Roach. India XI: Rohit Sharma, Shikhar Dhawan, Virat Kohli (c), Rishabh Pant (wk), Shreyas Iyer, Kedar Jadhav, Ravindra Jadeja, Bhuvneshwar Kumar, Mohammed Shami, Yuzvendra Chahal, Khaleel Ahmed, Manish Pandey.