





























The Hundred 2026
EnglandThe Hundred Player Bowling Average 2026
Every player ranked on bowling averages. Sorted on at least 10 overs.
Updated 16 August 2026, after Trent Rockets vs Manchester Super Giants
| #Player | M | Overs | Wkts | Econ | Avg | SR | Dots | Dot % | Mdns | Best |
|---|---|---|---|---|---|---|---|---|---|---|
1
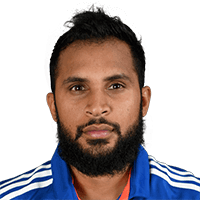  Adil Rashid Bowler |
8 | 27 | 1.4 | 6.11 | 15.00 | 14.7 | 7.1 | 35.2% | 0.0 | 3 |
2
 Marcus Stoinis All-rounder |
7 | 21.2 | 1.4 | 7.78 | 16.60 | 12.8 | 6.6 | 35.9% | 0.0 | 3 |
3
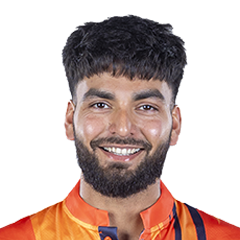 Nikhil Chaudhary Bowler |
7 | 10.1 | 1.0 | 8.16 | 16.60 | 12.2 | 3.4 | 27.9% | 0.0 | 2 |
4
  Richard Gleeson Bowler |
8 | 24.3 | 1.8 | 9.63 | 16.86 | 10.5 | 6.0 | 32.7% | 0.0 | 4 |
5
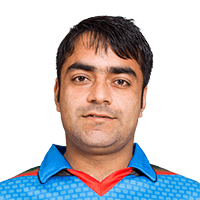 Rashid Khan Bowler |
5 | 16.1 | 1.4 | 7.48 | 17.29 | 13.9 | 7.4 | 38.1% | 0.0 | 5 |
6
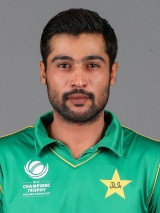  Mohammad Amir Bowler |
7 | 21.5 | 1.3 | 7.47 | 18.11 | 14.6 | 7.7 | 41.2% | 0.0 | 3 |
7
  Josh Tongue Bowler |
10 | 34.2 | 1.4 | 7.49 | 18.36 | 14.7 | 9.2 | 44.7% | 0.0 | 4 |
8
  Ben Dwarshuis Bowler |
4 | 13.1 | 1.3 | 7.14 | 18.80 | 15.8 | 8.0 | 40.5% | 0.0 | 2 |
|
9
C
Calvin Harrison All-rounder
|
9 | 21.5 | 1.1 | 9.02 | 19.70 | 13.1 | 3.9 | 26.7% | 0.0 | 2 |
10
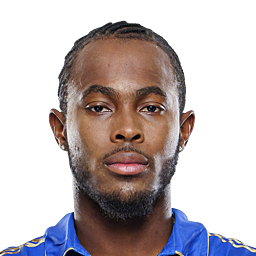 Jofra Archer Bowler |
7 | 23 | 1.1 | 6.91 | 19.88 | 17.3 | 8.3 | 42.0% | 0.0 | 4 |
11
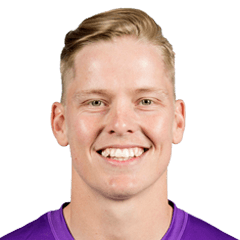  Nathan Ellis Bowler |
9 | 31.1 | 1.2 | 7.57 | 21.45 | 17.0 | 7.4 | 35.8% | 0.0 | 2 |
|
12
S
Sonny Baker Bowler
|
9 | 29.1 | 1.4 | 9.87 | 22.15 | 13.5 | 7.0 | 36.0% | 0.0 | 2 |
13
 Gus Atkinson All-rounder |
10 | 33.1 | 1.2 | 8.23 | 22.75 | 16.6 | 9.3 | 46.7% | 0.0 | 3 |
14
 Liam Dawson Bowler |
10 | 27.4 | 1.0 | 8.46 | 23.40 | 16.6 | 5.7 | 34.3% | 0.0 | 3 |
15
 Brydon Carse Bowler |
9 | 31.1 | 1.3 | 9.02 | 23.42 | 15.6 | 8.0 | 38.5% | 0.0 | 3 |
16
 Trent Boult Bowler |
8 | 28 | 1.1 | 7.61 | 23.67 | 18.7 | 9.0 | 42.9% | 0.0 | 2 |
17
  Rachin Ravindra All-rounder |
8 | 16.4 | 0.86 | 8.52 | 23.67 | 16.7 | 4.3 | 30.0% | 0.0 | 2 |
18
 Chris Wood All-rounder |
4 | 12 | 1.0 | 8.08 | 24.25 | 18.0 | 6.8 | 37.5% | 0.0 | 2 |
19
 Lockie Ferguson Bowler |
8 | 26.4 | 1.1 | 8.21 | 24.33 | 17.8 | 7.5 | 37.5% | 0.0 | 4 |
20
  David Willey All-rounder |
8 | 23.1 | 1.0 | 8.63 | 25.00 | 17.4 | 7.5 | 43.2% | 0.0 | 3 |
21
 Adam Milne Bowler |
8 | 25.5 | 1.0 | 7.78 | 25.13 | 19.4 | 7.6 | 39.4% | 0.0 | 2 |
22
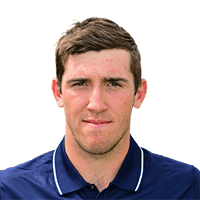 Craig Overton Bowler |
9 | 27.1 | 0.89 | 7.73 | 26.25 | 20.4 | 8.4 | 46.6% | 0.0 | 3 |
23
 Usman Tariq Bowler |
7 | 23.5 | 0.86 | 6.76 | 26.83 | 23.8 | 7.3 | 35.7% | 0.0 | 2 |
24
 Chris Woakes All-rounder |
8 | 26.2 | 1.0 | 8.20 | 27.00 | 19.8 | 8.1 | 41.1% | 0.0 | 2 |
25
 Rehan Ahmed All-rounder |
8 | 20 | 0.88 | 9.45 | 27.00 | 17.1 | 4.0 | 26.7% | 0.0 | 3 |
26
 Sam Curran All-rounder |
7 | 17.2 | 1.0 | 9.46 | 27.33 | 17.3 | 4.3 | 25.0% | 0.0 | 2 |
|
27
J
James Coles All-rounder
|
8 | 18.3 | 0.71 | 7.95 | 29.40 | 22.2 | 4.7 | 29.7% | 0.0 | 1 |
28
 Jamie Overton Bowler |
8 | 18.4 | 0.75 | 9.64 | 30.00 | 18.7 | 4.8 | 33.9% | 0.0 | 3 |
29
 Tom Curran All-rounder |
8 | 22.4 | 0.88 | 9.57 | 31.00 | 19.4 | 4.6 | 27.2% | 0.0 | 2 |
30
 Nathan Sowter All-rounder |
6 | 11.4 | 0.50 | 7.97 | 31.00 | 23.3 | 4.2 | 35.7% | 0.0 | 2 |
31
 Lewis Gregory All-rounder |
9 | 24.3 | 0.78 | 9.55 | 33.43 | 21.0 | 4.0 | 24.5% | 0.0 | 2 |
32
 Chris Jordan Bowler |
8 | 22.4 | 0.75 | 8.87 | 33.50 | 22.7 | 4.9 | 28.7% | 0.0 | 1 |
33
 Samuel Cook Bowler |
8 | 23.3 | 0.88 | 10.04 | 33.71 | 20.1 | 5.3 | 29.8% | 0.0 | 3 |
34
 Tom Helm Bowler |
3 | 10.1 | 1.0 | 10.03 | 34.00 | 20.3 | 5.0 | 24.6% | 0.0 | 1 |
35
 Mitchell Santner All-rounder |
9 | 27 | 0.67 | 7.74 | 34.83 | 27.0 | 5.7 | 31.5% | 0.0 | 3 |
36
 Marco Jansen All-rounder |
8 | 26.4 | 0.75 | 7.88 | 35.00 | 26.7 | 8.3 | 41.3% | 0.0 | 2 |
37
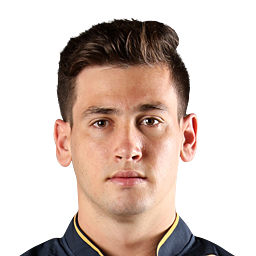 Noor Ahmad Bowler |
10 | 33.2 | 0.80 | 9.51 | 39.63 | 25.0 | 5.7 | 28.5% | 0.0 | 3 |
38
 Matty Potts All-rounder |
9 | 30.3 | 0.78 | 9.84 | 42.86 | 26.1 | 5.8 | 28.4% | 0.0 | 3 |
39
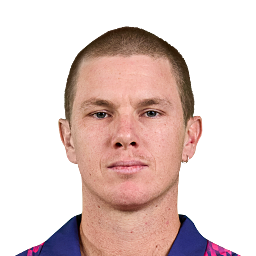 Adam Zampa Bowler |
5 | 12.4 | 0.60 | 10.50 | 44.33 | 25.3 | 4.6 | 30.3% | 0.0 | 2 |
40
 Matt Henry Bowler |
8 | 21.2 | 0.63 | 10.92 | 46.60 | 25.6 | 4.9 | 30.5% | 0.0 | 2 |
41
 Abrar Ahmed Bowler |
8 | 21.4 | 0.50 | 9.74 | 52.75 | 32.5 | 4.1 | 25.4% | 0.0 | 2 |
42
 Scott Currie Bowler |
5 | 14.4 | 0.60 | 10.84 | 53.00 | 29.3 | 3.8 | 21.6% | 0.0 | 2 |
43
 Luke Wood All-rounder |
7 | 17.5 | 0.43 | 10.65 | 63.33 | 35.7 | 4.6 | 29.9% | 0.0 | 3 |
44
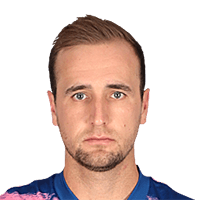 Liam Livingstone All-rounder |
8 | 14.1 | 0.29 | 9.60 | 68.00 | 42.5 | 3.9 | 31.8% | 0.0 | 2 |
45
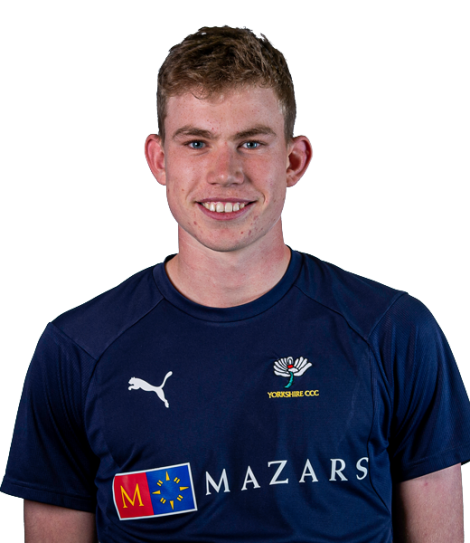 Matthew Revis Batter |
7 | 13.3 | 0.40 | 11.33 | 76.50 | 40.5 | 2.2 | 13.6% | 0.0 | 1 |
46
 Saqib Mahmood All-rounder |
7 | 20.1 | 0.43 | 11.50 | 77.33 | 40.3 | 5.4 | 31.4% | 0.0 | 1 |
The Hundred Stats Questions
The Hundred 2026 player and team stats: runs, averages and strike rates, wickets and economy, fielding and Dream11 points, and every side's batting, bowling and fielding. Statz tracks The Hundred 2026 across the points table, season leaderboards and venue scoring trends, updated after every completed match.
The Hundred on Statz
Frequently asked questions
Who scored the most runs in the The Hundred 2026?
Mitchell Marsh (Sunrisers Leeds) with 416 runs in 9 matches, at a strike rate of 169.8.
Who took the most wickets in the The Hundred 2026?
Richard Gleeson (MI London) with 14 wickets at 9.63 an over.
Who hit the most sixes in the The Hundred 2026?
Mitchell Marsh with 29 sixes.