



























T20 Internationals 2018
InternationalIndia have won the most T20Is in 2018: 7 from 8.
2018 Record
Bilateral T20Is have no table: every side's year, most wins first
| # | Team | P | W | L | NR | Win % | NRR | Form |
|---|---|---|---|---|---|---|---|---|
| 1 |  India |
8 | 7 | 1 | 0 | 88% | +0.843 | LWWWW |
| 2 |  Pakistan |
6 | 6 | 0 | 0 | 100% | +1.355 | WWWWW |
| 3 |  England |
5 | 3 | 2 | 0 | 60% | +0.408 | WLWLW |
| 4 |  Bangladesh |
6 | 3 | 3 | 0 | 50% | -0.899 | WWLWL |
| 5 |  West Indies |
9 | 3 | 6 | 0 | 33% | +0.844 | LLWLW |
| 6 |  South Africa |
3 | 2 | 1 | 1 | 67% | +0.641 | LWW |
| 7 |  Sri Lanka |
2 | 1 | 1 | 0 | 50% | -0.014 | WL |
| 8 |  Australia |
6 | 1 | 5 | 0 | 17% | -0.748 | WLLLL |
| 9 |  New Zealand |
3 | 0 | 3 | 0 | 0% | -0.877 | LLL |
| 10 |  United Arab Emirates |
1 | 0 | 1 | 0 | 0% | -1.219 | L |
| 11 |  Zimbabwe |
1 | 0 | 1 | 1 | 0% | -2.017 | L |
| 12 |  Ireland |
2 | 0 | 2 | 0 | 0% | -5.475 | LL |
Top Run Scorers
 Rohit SharmaIND · 8 matches · SR 153.7
355
2
 Babar AzamPAK · 6 matches · SR 117.0
289
3
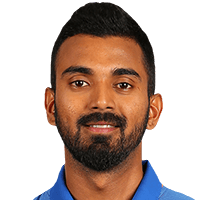 Lokesh RahulIND · 7 matches · SR 165.6
255
4
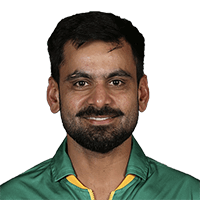 Mohammad HafeezPAK · 6 matches · SR 138.9
243
5
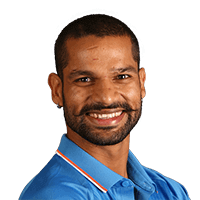 Shikhar DhawanIND · 7 matches · SR 132.0
231
6
 Jason RoyENG · 5 matches · SR 180.0
225
7
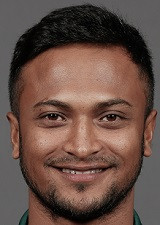 Shakib Al HasanBAN · 6 matches · SR 147.1
206
8
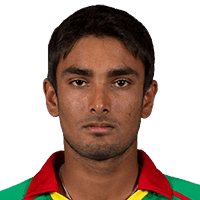 Litton DasBAN · 6 matches · SR 159.8
195
9
 Jos ButtlerENG · 5 matches · SR 164.7
191
10
 Shai HopeWI · 6 matches · SR 168.1
158
Top Wicket Takers
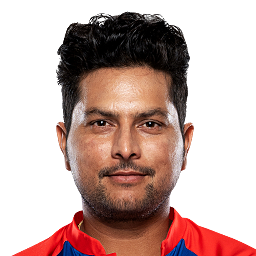 Kuldeep YadavIND · 6 matches · Econ 17.50
17
2
 Keemo PaulWI · 9 matches · Econ 10.78
16
3
 Mustafizur RahmanBAN · 6 matches · Econ 20.74
13
4
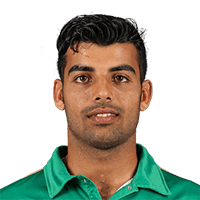 Shadab KhanPAK · 6 matches
11
5
Shakib Al HasanBAN · 6 matches · Econ 13.08
11
6
 Billy StanlakeAUS · 5 matches · Econ 43.20
9
7
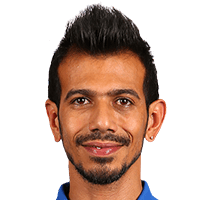 Yuzvendra ChahalIND · 6 matches · Econ 39.78
9
8
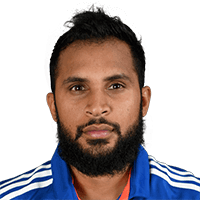 Adil RashidENG · 5 matches
8
9
 Imad WasimPAK · 6 matches · Econ 17.14
8
10
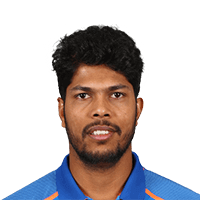 Umesh YadavIND · 5 matches · Econ 40.00
8
Fixtures & Results
 West Indies
93/3(9.1)
Bangladesh
143/9(20)
West Indies
159/9(20)
Bangladesh
171/5(20)
West Indies
109/8(20)
Power Rankings
| # | Team | Bat | Bowl | Ovr |
|---|---|---|---|---|
| 1 | Pakistan |
96.9 | 79.8 | +17.1 |
| 2 | India |
107.1 | 96.5 | +10.6 |
| 3 | West Indies |
109.1 | 98.4 | +10.6 |
| 4 | South Africa |
94.1 | 86.0 | +8.1 |
| 5 | England |
116.4 | 111.3 | +5.1 |
| 6 | Sri Lanka |
89.6 | 89.8 | -0.2 |
| 7 | New Zealand |
87.8 | 98.8 | -11.0 |
| 8 | Bangladesh |
102.2 | 113.5 | -11.3 |
| 9 | Australia |
90.4 | 105.4 | -15.0 |
| 10 | Zimbabwe |
83.2 | 108.6 | -25.4 |
| 11 | Ireland |
63.6 | 132.6 | -69.0 |
Player Stats
Rohit SharmaIND · 8 matches · SR 153.7
18
2
Lokesh RahulIND · 7 matches · SR 165.6
14
3
Jason RoyENG · 5 matches · SR 180.0
14
4
Mohammad HafeezPAK · 6 matches · SR 138.9
11
5
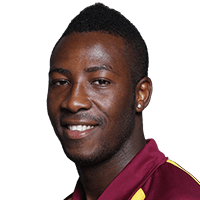 Andre RussellWI · 3 matches · SR 190.4
11
 Evin LewisWI · 111 runs
182.0
2
Jason RoyENG · 225 runs
180.0
3
Shai HopeWI · 158 runs
168.1
4
Lokesh RahulIND · 255 runs
165.6
5
Jos ButtlerENG · 191 runs
164.7



Statz MVP
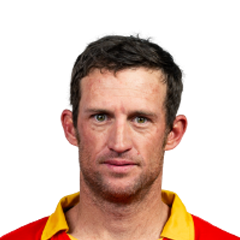 Sean WilliamsZIM · 1 matches · a match
113.7
2
Shakib Al HasanBAN · 6 matches · a match
112.1
3
 Akila DananjayaSL · 1 matches · a match
79.2
4
 Peter ChaseIRE · 2 matches · a match
75.5
5
Kuldeep YadavIND · 6 matches · a match
74.2
Team Stats
England5 games
178.6
2
India8 games
167.8
3
Bangladesh6 games
162.0
4
Pakistan6 games
153.3
5
West Indies9 games
151.0
Sixes
| # | Team | Last 5 | O5.5 | Avg |
|---|---|---|---|---|
| 1 | ZIM |
8 | 100% | 8.0 |
| 2 | ENG |
10461210 | 80% | 8.4 |
| 3 | WI |
4910612 | 78% | 7.3 |
| 4 | IND |
411185 | 63% | 7.6 |
| 5 | BAN |
65268 | 50% | 4.8 |
Match Totals
| # | Team | Last 5 | O290.5 | Avg |
|---|---|---|---|---|
| 1 | ENG |
414322297399344 | 100% | 355.2 |
| 2 | IND |
297399219319363 | 75% | 317.8 |
| 3 | WI |
319363255376330 | 67% | 305.2 |
| 4 | BAN |
330319255376330 | 67% | 307.7 |
| 5 | NZ |
294307285 | 67% | 295.3 |
Streaks
Mohammad HafeezPakistan · avg 40.5
6
2
Shai HopeWest Indies · avg 34.5
4
3
Virat KohliIndia · avg 36.7
3
4
Quinton de KockSouth Africa · avg 22.7
3
Grounds
| # | Ground | M | Chased | 1st Inns |
|---|---|---|---|---|
| 1 | Rajiv Gandhi International StadiumHyderabad | 13 | 46% | 221 |
| 2 | Maharaja Yadavindra Singh International Cricket Stadium, MullanpurChandigarh | 13 | 46% | 219 |
| 3 | Wankhede StadiumMumbai | 22 | 45% | 218 |
| 4 | Sawai Mansingh StadiumJaipur | 11 | 64% | 215 |
| 5 | The Rose BowlSouthampton | 10 | 20% | 214 |
T20 Internationals Questions
Rohit Sharma has the most runs (355). Kuldeep Yadav has the most wickets (17). Statz tracks T20 Internationals 2018 across the points table, season leaderboards and venue scoring trends, updated after every completed match.
T20 Internationals on Statz
Frequently asked questions
Who scored the most runs in T20I 2018?
Rohit Sharma (India) finished top with 355 runs, ahead of Babar Azam (289) and Lokesh Rahul (255). The T20I 2018 runs leaderboard ranks every player, with their team and matches.
Who took the most wickets in T20I 2018?
Kuldeep Yadav (India) finished top with 17 wickets, ahead of Keemo Paul (16) and Mustafizur Rahman (13). The T20I 2018 wickets leaderboard ranks every player, with their team and matches.
Who hit the most sixes in T20I 2018?
Rohit Sharma (India) finished top with 18 sixes, ahead of Lokesh Rahul (14) and Jason Roy (14). The T20I 2018 sixes leaderboard ranks every player, with their team and matches.
What were the latest results in T20I 2018?
Bangladesh vs West Indies (22 Dec): West Indies won by 50 runs. Bangladesh vs West Indies (20 Dec): Bangladesh won by 36 runs. Bangladesh vs West Indies (17 Dec): West Indies won by 8 wickets (with 55 balls remaining).