



























T20 Internationals 2018
InternationalT20 Internationals Player Stats 2018
Who is leading the way on runs, wickets, strike rates and much more.
Updated 22 December 2018, after Bangladesh vs West Indies
| #Player | M | Overs | Wkts | Econ | Avg | SR | Dots | Dot % | Mdns | Best |
|---|---|---|---|---|---|---|---|---|---|---|
1
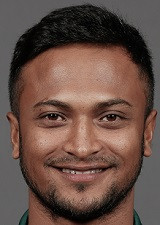  Shakib Al Hasan All-rounder |
3 | 12 | 8 | 7.42 | 11.13 | 9.0 | 34 | 47.2% | 0 | 5 |
2
  Imad Wasim All-rounder |
6 | 8.1 | 8 | 17.14 | 17.50 | 6.1 | 16 | 32.7% | 1 | 3 |
3
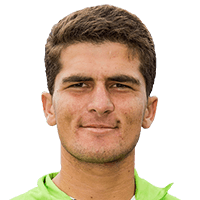 Shaheen Afridi Bowler |
4 | 4 | 7 | 26.75 | 15.29 | 3.4 | 12 | 50.0% | 0 | 3 |
4
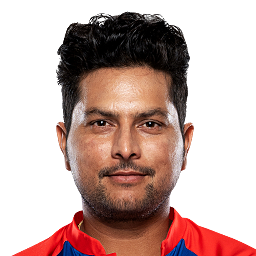  Kuldeep Yadav Bowler |
2 | 8 | 5 | 5.63 | 9.00 | 9.6 | 29 | 60.4% | 0 | 3 |
5
 Mustafizur Rahman Bowler |
3 | 9.3 | 5 | 10.32 | 19.60 | 11.4 | 17 | 29.8% | 0 | 3 |
6
 Mohammad Mahmudullah All-rounder |
3 | 6 | 5 | 5.33 | 6.40 | 7.2 | 14 | 38.9% | 0 | 3 |
7
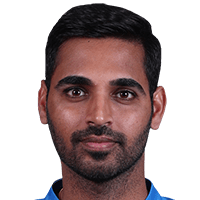 Bhuvneshwar Kumar Bowler |
2 | 8 | 3 | 6.38 | 17.00 | 16.0 | 25 | 52.1% | 0 | 3 |
8
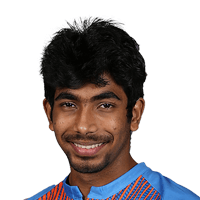 Jasprit Bumrah Bowler |
2 | 8.1 | 3 | 5.76 | 15.67 | 16.3 | 23 | 46.9% | 0 | 2 |
9
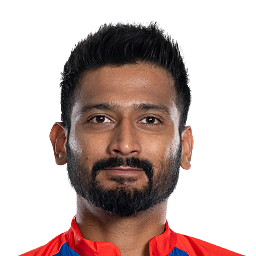 Khaleel Ahmed Bowler |
3 | 12.3 | 3 | 6.64 | 27.67 | 25.0 | 39 | 52.0% | 1 | 2 |
10
  Nathan Coulter-Nile All-rounder |
1 | 2 | 2 | 9.50 | 9.50 | 6.0 | 6 | 50.0% | 0 | 2 |
11
 Andrew Tye Bowler |
1 | 2.2 | 2 | 7.71 | 9.00 | 7.0 | 4 | 28.6% | 0 | 2 |
12
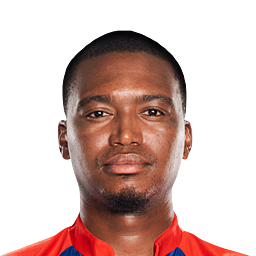  Lungi Ngidi Bowler |
1 | 4.1 | 2 | 8.64 | 18.00 | 12.5 | 11 | 44.0% | 0 | 2 |
13
 Dane Paterson Bowler |
1 | 4 | 2 | 5.50 | 11.00 | 12.0 | 17 | 70.8% | 0 | 2 |
14
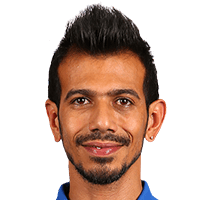 Yuzvendra Chahal Bowler |
1 | 4.3 | 2 | 6.22 | 14.00 | 13.5 | 8 | 29.6% | 0 | 2 |
15
 Waqas Maqsood Bowler |
1 | 1.5 | 2 | 11.45 | 10.50 | 5.5 | 3 | 27.3% | 0 | 2 |
16
 Robbie Frylinck Bowler |
1 | 4 | 2 | 5.00 | 10.00 | 12.0 | 11 | 45.8% | 0 | 2 |
17
 Glenn Maxwell All-rounder |
1 | 2 | 1 | 7.00 | 14.00 | 12.0 | 5 | 41.7% | 0 | 1 |
18
 Billy Stanlake Bowler |
1 | 2.2 | 1 | 9.86 | 23.00 | 14.0 | 5 | 35.7% | 0 | 1 |
19
 Umesh Yadav Bowler |
1 | 4 | 1 | 9.00 | 36.00 | 24.0 | 10 | 41.7% | 0 | 1 |
20
 Tabraiz Shamsi Bowler |
1 | 4.1 | 1 | 8.88 | 37.00 | 25.0 | 8 | 32.0% | 0 | 1 |
21
 Abu Hider Bowler |
3 | 7.3 | 1 | 11.60 | 87.00 | 45.0 | 17 | 37.8% | 0 | 1 |
22
 Mehidy Hasan Miraz All-rounder |
3 | 7 | 1 | 12.29 | 86.00 | 42.0 | 13 | 31.0% | 0 | 1 |
23
 Mohammad Saifuddin All-rounder |
3 | 9.3 | 1 | 9.58 | 91.00 | 57.0 | 17 | 29.8% | 0 | 1 |
24
 Usman Shinwari Bowler |
2 | 3 | 1 | 15.33 | 46.00 | 18.0 | 6 | 33.3% | 0 | 1 |
25
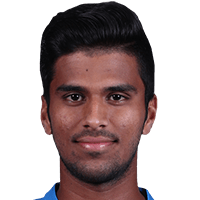 Washington Sundar All-rounder |
1 | 4.3 | 1 | 7.33 | 33.00 | 27.0 | 13 | 48.1% | 0 | 1 |
26
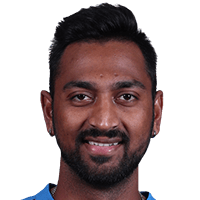 Krunal Pandya All-rounder |
3 | 13.1 | 1 | 5.92 | 78.00 | 79.0 | 35 | 44.3% | 0 | 1 |
27
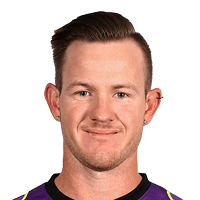 D'Arcy Short Batter |
1 | 1 | 0 | 12.00 | - | - | 0 | 0.0% | 0 | 0 |
28
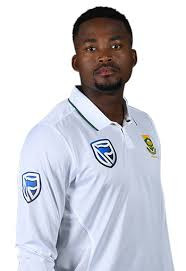 Andile Phehlukwayo All-rounder |
1 | 4 | 0 | 3.75 | - | - | 14 | 58.3% | 0 | 0 |
29
 Jason Behrendorff Bowler |
1 | 1 | 0 | 15.00 | - | - | 2 | 33.3% | 0 | 0 |
T20 Internationals Stats Questions
T20 Internationals 2018 player and team stats: runs, averages and strike rates, wickets and economy, fielding and Dream11 points, and every side's batting, bowling and fielding. Statz tracks T20 Internationals 2018 across the points table, season leaderboards and venue scoring trends, updated after every completed match.
T20 Internationals on Statz
Frequently asked questions
Who scored the most runs in the T20 Internationals 2018?
Rohit Sharma (India) with 355 runs in 8 matches, at a strike rate of 153.7.
Who took the most wickets in the T20 Internationals 2018?
Kuldeep Yadav (India) with 17 wickets at 17.50 an over.
Who hit the most sixes in the T20 Internationals 2018?
Rohit Sharma with 18 sixes.