



























T20 World Cup 2016
InternationalT20 World Cup Player Economy Rate 2016
Every player ranked on economy rates. Sorted on at least 10 overs.
Updated 3 April 2016, after England vs West Indies
| #Player | M | Overs | Wkts | Econ | Avg | SR | Dots | Dot % | Mdns | Best |
|---|---|---|---|---|---|---|---|---|---|---|
1
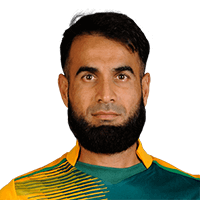  Imran Tahir Bowler |
4 | 16.3 | 6 | 5.03 | 13.83 | 16.5 | 34 | 34.3% | 0 | 2 |
2
  Jeffrey Vandersay Bowler |
3 | 12 | 3 | 5.17 | 20.67 | 24.0 | 39 | 54.2% | 1 | 2 |
3
  Samuel Badree Batter |
6 | 23.2 | 9 | 5.31 | 13.78 | 15.6 | 70 | 50.0% | 1 | 3 |
4
  Grant Elliott All-rounder |
5 | 13.1 | 3 | 5.70 | 25.00 | 26.3 | 31 | 39.2% | 0 | 3 |
5
 Dushmantha Chameera Bowler |
3 | 12 | 0 | 5.83 | - | - | 27 | 37.5% | 0 | 0 |
6
  Ashish Nehra Bowler |
5 | 19 | 5 | 5.95 | 22.60 | 22.8 | 56 | 49.1% | 0 | 1 |
7
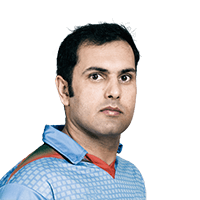  Mohammad Nabi All-rounder |
7 | 27.3 | 12 | 5.96 | 13.67 | 13.8 | 70 | 42.4% | 1 | 4 |
8
 Ish Sodhi Bowler |
5 | 20 | 10 | 6.00 | 12.00 | 12.0 | 43 | 35.8% | 0 | 3 |
9
  Taskin Ahmed Bowler |
3 | 10.1 | 3 | 6.00 | 20.33 | 20.3 | 31 | 50.8% | 0 | 2 |
10
  Mark Watt Bowler |
3 | 12 | 4 | 6.00 | 18.00 | 18.0 | 28 | 38.9% | 0 | 2 |
11
 Samiullah Shinwari All-rounder |
7 | 22.5 | 3 | 6.04 | 46.00 | 45.7 | 48 | 35.0% | 0 | 1 |
12
 Mitchell Santner All-rounder |
5 | 18.5 | 10 | 6.05 | 11.40 | 11.3 | 55 | 48.7% | 0 | 4 |
13
  Liam Plunkett Bowler |
4 | 16.5 | 2 | 6.06 | 51.00 | 50.5 | 45 | 44.6% | 1 | 1 |
14
 Hamid Hassan All-rounder |
4 | 14 | 3 | 6.07 | 28.33 | 28.0 | 34 | 40.5% | 0 | 2 |
15
 Rangana Herath Bowler |
4 | 16.1 | 3 | 6.12 | 33.00 | 32.3 | 43 | 44.3% | 1 | 2 |
16
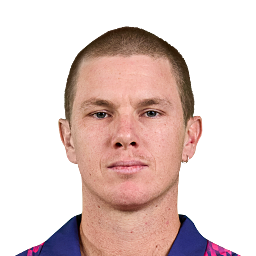  Adam Zampa Bowler |
4 | 11 | 5 | 6.45 | 14.20 | 13.2 | 23 | 34.8% | 0 | 3 |
17
 Rashid Khan Bowler |
7 | 28.2 | 11 | 6.46 | 16.64 | 15.5 | 69 | 40.6% | 0 | 3 |
18
  Tinashe Panyangara Bowler |
3 | 12.1 | 4 | 6.49 | 19.75 | 18.3 | 29 | 39.7% | 0 | 3 |
19
  Ryan Campbell Keeper |
3 | 10.1 | 2 | 6.69 | 34.00 | 30.5 | 23 | 37.7% | 0 | 2 |
20
 Ravindra Jadeja All-rounder |
5 | 20 | 4 | 6.80 | 34.00 | 30.0 | 49 | 40.8% | 0 | 2 |
21
 Mashrafe Mortaza Bowler |
6 | 17.2 | 3 | 6.81 | 39.33 | 34.7 | 36 | 34.6% | 0 | 1 |
22
 Sulieman Benn Bowler |
6 | 22 | 2 | 6.82 | 75.00 | 66.0 | 44 | 33.3% | 0 | 1 |
23
 Amir Hamza Afghanistan |
4 | 15 | 3 | 6.87 | 34.33 | 30.0 | 45 | 50.0% | 0 | 1 |
24
 Nadeem Ahmed Bowler |
3 | 10.1 | 3 | 6.89 | 23.33 | 20.3 | 26 | 42.6% | 0 | 1 |
25
 Corey Anderson All-rounder |
5 | 12.1 | 2 | 6.90 | 42.00 | 36.5 | 28 | 38.4% | 0 | 2 |
26
  Imad Wasim All-rounder |
3 | 10 | 3 | 7.00 | 23.33 | 20.0 | 15 | 25.0% | 0 | 2 |
27
 Shane Watson All-rounder |
4 | 14.4 | 5 | 7.02 | 20.60 | 17.6 | 30 | 34.1% | 0 | 2 |
28
 Mustafizur Rahman Bowler |
3 | 12.1 | 9 | 7.07 | 9.56 | 8.1 | 32 | 43.8% | 0 | 5 |
29
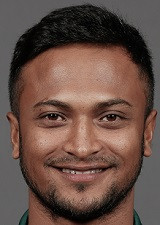 Shakib Al Hasan All-rounder |
6 | 23.2 | 10 | 7.07 | 16.50 | 14.0 | 53 | 37.9% | 0 | 4 |
30
 Adam Milne Bowler |
4 | 11.4 | 3 | 7.11 | 27.67 | 23.3 | 26 | 37.1% | 0 | 2 |
31
 Shahid Afridi All-rounder |
4 | 16.3 | 4 | 7.21 | 29.75 | 24.8 | 31 | 31.3% | 0 | 2 |
32
 David Willey All-rounder |
6 | 22 | 10 | 7.23 | 15.90 | 13.2 | 58 | 43.9% | 0 | 3 |
33
 Josh Davey All-rounder |
3 | 12 | 2 | 7.25 | 43.50 | 36.0 | 27 | 37.5% | 0 | 1 |
34
 Wellington Masakadza Bowler |
3 | 12.1 | 5 | 7.32 | 17.80 | 14.6 | 36 | 49.3% | 0 | 4 |
35
 Ravichandran Ashwin Bowler |
5 | 15.4 | 4 | 7.34 | 28.75 | 23.5 | 39 | 41.5% | 0 | 2 |
36
 Mohammad Amir Bowler |
4 | 15.5 | 3 | 7.45 | 39.33 | 31.7 | 42 | 44.2% | 1 | 2 |
37
 Andre Russell All-rounder |
6 | 25 | 9 | 7.56 | 21.00 | 16.7 | 66 | 44.0% | 0 | 2 |
38
 Jasprit Bumrah Bowler |
5 | 20.1 | 4 | 7.59 | 38.25 | 30.3 | 47 | 38.8% | 0 | 1 |
39
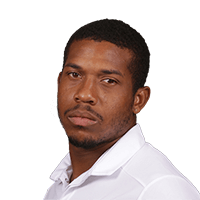 Chris Jordan Bowler |
6 | 24.4 | 6 | 7.62 | 31.33 | 24.7 | 55 | 37.2% | 0 | 4 |
40
 Donald Tiripano Bowler |
3 | 11.3 | 5 | 7.65 | 17.60 | 13.8 | 28 | 40.6% | 0 | 2 |
41
 Kyle Abbott Batter |
3 | 11.5 | 7 | 7.69 | 13.00 | 10.1 | 30 | 42.3% | 0 | 3 |
42
 Dwayne Bravo All-rounder |
6 | 24.4 | 9 | 7.70 | 21.11 | 16.4 | 49 | 33.1% | 0 | 3 |
43
 Carlos Brathwaite All-rounder |
6 | 18.4 | 4 | 7.77 | 36.25 | 28.0 | 29 | 25.9% | 0 | 3 |
44
 Mitchell McClenaghan Bowler |
4 | 11 | 4 | 7.91 | 21.75 | 16.5 | 22 | 33.3% | 0 | 3 |
45
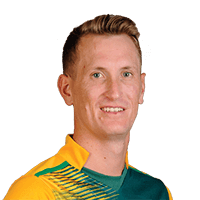 Chris Morris All-rounder |
3 | 12.2 | 5 | 7.95 | 19.60 | 14.8 | 29 | 39.2% | 0 | 4 |
46
 James Faulkner All-rounder |
4 | 13.1 | 8 | 8.05 | 13.25 | 9.9 | 26 | 32.9% | 0 | 5 |
47
 Nathan Coulter-Nile All-rounder |
4 | 16.1 | 1 | 8.16 | 132.00 | 97.0 | 36 | 37.1% | 0 | 1 |
48
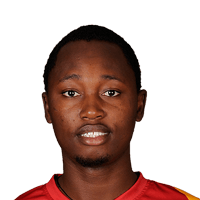 Tendai Chatara Bowler |
3 | 10.3 | 4 | 8.19 | 21.50 | 15.8 | 28 | 44.4% | 0 | 2 |
49
 Wahab Riaz Bowler |
3 | 10 | 3 | 8.20 | 27.33 | 20.0 | 26 | 43.3% | 0 | 2 |
50
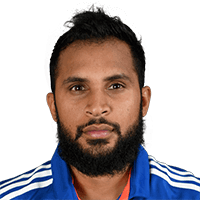 Adil Rashid Bowler |
6 | 19.3 | 5 | 8.21 | 32.00 | 23.4 | 35 | 29.9% | 0 | 2 |
51
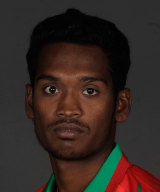 Al-Amin Hossain Bowler |
6 | 18.2 | 8 | 8.45 | 19.38 | 13.8 | 47 | 42.7% | 0 | 2 |
52
 Mohammad Sami Bowler |
3 | 10.5 | 4 | 8.58 | 23.25 | 16.3 | 26 | 40.0% | 0 | 2 |
53
 Ben Stokes All-rounder |
6 | 20.3 | 4 | 8.73 | 44.75 | 30.8 | 41 | 33.3% | 0 | 3 |
54
 Dawlat Zadran Bowler |
5 | 18.5 | 2 | 8.92 | 84.00 | 56.5 | 43 | 38.1% | 0 | 1 |
55
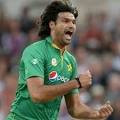 Mohammad Irfan Bowler |
3 | 11.1 | 2 | 9.04 | 50.50 | 33.5 | 22 | 32.8% | 0 | 1 |
56
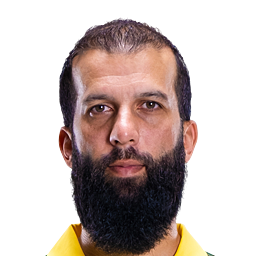 Moeen Ali All-rounder |
6 | 14 | 5 | 9.36 | 26.20 | 16.8 | 24 | 28.6% | 0 | 2 |
57
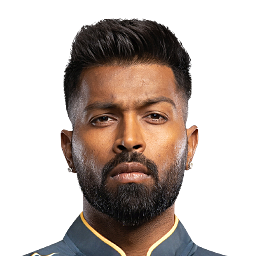 Hardik Pandya All-rounder |
5 | 14.3 | 5 | 9.86 | 28.60 | 17.4 | 30 | 34.5% | 0 | 2 |
58
 Kagiso Rabada Bowler |
3 | 12.4 | 5 | 9.87 | 25.00 | 15.2 | 30 | 39.5% | 0 | 2 |
T20 World Cup Stats Questions
T20 World Cup 2016 player and team stats: runs, averages and strike rates, wickets and economy, fielding and Dream11 points, and every side's batting, bowling and fielding. Statz tracks T20 World Cup 2016 across the points table, season leaderboards and venue scoring trends, updated after every completed match.
T20 World Cup on Statz
Frequently asked questions
Who scored the most runs in the T20 World Cup 2016?
Tamim Iqbal (Bangladesh) with 295 runs in 6 matches, at a strike rate of 142.5.
Who took the most wickets in the T20 World Cup 2016?
Mohammad Nabi (Afghanistan) with 12 wickets at 5.96 an over.
Who hit the most sixes in the T20 World Cup 2016?
Tamim Iqbal with 14 sixes.