



























T20 World Cup 2009
InternationalT20 World Cup Player Bowling Strike Rate 2009
Every player ranked on bowling strike rates. Sorted on at least 10 overs.
Updated 21 June 2009, after Pakistan vs Sri Lanka
| #Player | M | Overs | Wkts | Econ | Avg | SR | Dots | Dot % | Mdns | Best |
|---|---|---|---|---|---|---|---|---|---|---|
1
  Dwayne Bravo All-rounder |
5 | 17.3 | 10 | 8.86 | 15.50 | 10.5 | 33 | 31.4% | 0 | 4 |
2
  Umar Gul Bowler |
4 | 15.1 | 8 | 4.81 | 9.13 | 11.4 | 41 | 45.1% | 0 | 5 |
3
  Dale Steyn Bowler |
4 | 14.2 | 7 | 7.26 | 14.86 | 12.3 | 36 | 41.9% | 0 | 2 |
4
 Fidel Edwards Bowler |
3 | 13 | 6 | 7.08 | 15.33 | 13.0 | 33 | 42.3% | 0 | 3 |
5
 Wayne Parnell Bowler |
4 | 13.1 | 6 | 5.09 | 11.17 | 13.2 | 37 | 46.8% | 0 | 4 |
6
  Ajantha Mendis Bowler |
4 | 15.3 | 7 | 4.77 | 10.57 | 13.3 | 45 | 48.4% | 0 | 3 |
7
 Johan Botha All-rounder |
4 | 12.1 | 5 | 6.25 | 15.20 | 14.6 | 27 | 37.0% | 0 | 3 |
8
 Abdul Razzaq All-rounder |
4 | 12.3 | 5 | 5.92 | 14.80 | 15.0 | 40 | 53.3% | 0 | 3 |
9
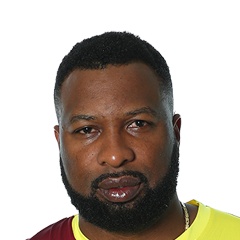 Kieron Pollard All-rounder |
5 | 10.1 | 4 | 7.57 | 19.25 | 15.3 | 20 | 32.8% | 0 | 1 |
10
 Muttiah Muralitharan Bowler |
4 | 15.2 | 6 | 5.22 | 13.33 | 15.3 | 40 | 43.5% | 0 | 3 |
11
  James Anderson Bowler |
3 | 10.4 | 4 | 6.94 | 18.50 | 16.0 | 23 | 35.9% | 0 | 3 |
12
 Roelof van der Merwe All-rounder |
4 | 16.1 | 6 | 5.51 | 14.83 | 16.2 | 40 | 41.2% | 0 | 2 |
13
 Jerome Taylor Bowler |
5 | 19 | 6 | 8.53 | 27.00 | 19.0 | 44 | 38.6% | 0 | 3 |
14
 Saeed Ajmal Bowler |
4 | 16.1 | 5 | 5.81 | 18.80 | 19.4 | 36 | 37.1% | 0 | 4 |
15
 Shahid Afridi All-rounder |
4 | 16.2 | 5 | 4.84 | 15.80 | 19.6 | 42 | 42.9% | 0 | 2 |
16
 Isuru Udana All-rounder |
3 | 10.4 | 3 | 7.59 | 27.00 | 21.3 | 25 | 39.1% | 0 | 2 |
17
 Lasith Malinga Bowler |
4 | 14.3 | 4 | 5.72 | 20.75 | 21.8 | 43 | 49.4% | 0 | 2 |
18
 Mohammad Amir Bowler |
4 | 15.1 | 4 | 6.73 | 25.50 | 22.8 | 43 | 47.3% | 1 | 1 |
19
  Harbhajan Singh Bowler |
4 | 16.2 | 4 | 6.49 | 26.50 | 24.5 | 34 | 34.7% | 1 | 3 |
20
 Zaheer Khan Bowler |
4 | 12.4 | 3 | 8.21 | 34.67 | 25.3 | 29 | 38.2% | 0 | 1 |
21
 Stuart Broad Bowler |
3 | 10.1 | 2 | 7.18 | 36.50 | 30.5 | 20 | 32.8% | 0 | 1 |
22
 Ishant Sharma Bowler |
4 | 12.1 | 2 | 8.79 | 53.50 | 36.5 | 24 | 32.9% | 0 | 2 |
23
 Sulieman Benn Bowler |
5 | 19.2 | 3 | 7.81 | 50.33 | 38.7 | 38 | 32.8% | 0 | 1 |
24
 Chris Gayle All-rounder |
5 | 13.1 | 1 | 7.06 | 93.00 | 79.0 | 25 | 31.6% | 0 | 1 |
T20 World Cup Stats Questions
T20 World Cup 2009 player and team stats: runs, averages and strike rates, wickets and economy, fielding and Dream11 points, and every side's batting, bowling and fielding. Statz tracks T20 World Cup 2009 across the points table, season leaderboards and venue scoring trends, updated after every completed match.
T20 World Cup on Statz
Frequently asked questions
Who scored the most runs in the T20 World Cup 2009?
Chris Gayle (West Indies) with 193 runs in 5 matches, at a strike rate of 134.0.
Who took the most wickets in the T20 World Cup 2009?
Dwayne Bravo (West Indies) with 10 wickets at 8.86 an over.
Who hit the most sixes in the T20 World Cup 2009?
Yuvraj Singh with 9 sixes.