




























SA20 2025/2026
 South Africa
SA20 Player Bowling Average 2025/2026
Every player ranked on bowling averages. Sorted on at least 10 overs.
Updated 25 January 2026, after Pretoria Capitals vs Sunrisers Eastern Cape
| #Player | M | Overs | Wkts | Econ | Avg | SR | Dots | Dot % | Mdns | Best |
|---|---|---|---|---|---|---|---|---|---|---|
1
  Ottneil Baartman Bowler |
4 | 14 | 11 | 6.79 | 8.64 | 7.6 | 36 | 42.9% | 1 | 5 |
2
  Anrich Nortje Bowler |
5 | 19.4 | 11 | 6.31 | 11.27 | 10.7 | 60 | 50.8% | 0 | 4 |
3
  Keshav Maharaj Bowler |
6 | 24.3 | 10 | 5.39 | 13.20 | 14.7 | 60 | 40.8% | 0 | 3 |
4
  Duan Jansen Bowler |
3 | 10.2 | 6 | 8.42 | 14.50 | 10.3 | 25 | 40.3% | 0 | 4 |
5
 Senuran Muthusamy Batter |
5 | 14.3 | 6 | 6.55 | 15.83 | 14.5 | 31 | 35.6% | 0 | 3 |
6
 Sikandar Raza All-rounder |
3 | 12 | 6 | 8.25 | 16.50 | 12.0 | 27 | 37.5% | 0 | 4 |
7
 Marco Jansen All-rounder |
5 | 20 | 6 | 5.05 | 16.83 | 20.0 | 66 | 55.0% | 1 | 3 |
|
8
G
Gideon Peters Bowler
|
4 | 13.1 | 5 | 7.44 | 19.60 | 15.8 | 28 | 35.4% | 0 | 3 |
9
 Wiaan Mulder All-rounder |
6 | 17.1 | 7 | 8.21 | 20.14 | 14.7 | 37 | 35.9% | 0 | 2 |
10
  Eathan Bosch Bowler |
3 | 14.1 | 6 | 9.25 | 21.83 | 14.2 | 29 | 34.1% | 0 | 4 |
11
 Richard Gleeson Bowler |
4 | 13.4 | 6 | 9.73 | 22.17 | 13.7 | 31 | 37.8% | 0 | 3 |
12
 Nandre Burger Bowler |
4 | 15.3 | 6 | 8.71 | 22.50 | 15.5 | 25 | 26.9% | 0 | 2 |
13
 Noor Ahmad Bowler |
4 | 17.1 | 4 | 6.17 | 26.50 | 25.8 | 37 | 35.9% | 0 | 3 |
14
  George Linde All-rounder |
4 | 13 | 3 | 6.23 | 27.00 | 26.0 | 36 | 46.2% | 0 | 2 |
15
 Lizaad Williams Bowler |
5 | 17.3 | 6 | 9.31 | 27.17 | 17.5 | 34 | 32.4% | 0 | 3 |
16
 Kagiso Rabada Bowler |
4 | 17.1 | 5 | 8.39 | 28.80 | 20.6 | 39 | 37.9% | 0 | 2 |
17
 Rashid Khan Bowler |
3 | 12.2 | 3 | 7.22 | 29.67 | 24.7 | 22 | 29.7% | 0 | 2 |
18
 Akeal Hosein Bowler |
6 | 21.1 | 5 | 7.51 | 31.80 | 25.4 | 42 | 33.1% | 0 | 1 |
19
 Roston Chase All-rounder |
4 | 14.4 | 3 | 6.75 | 33.00 | 29.3 | 39 | 44.3% | 0 | 1 |
20
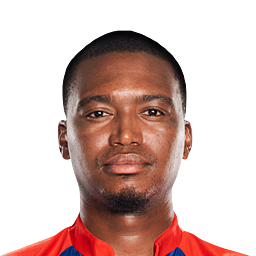 Lungi Ngidi Bowler |
6 | 20.4 | 5 | 8.13 | 33.60 | 24.8 | 55 | 44.4% | 0 | 3 |
21
 Corbin Bosch All-rounder |
3 | 11.1 | 3 | 9.94 | 37.00 | 22.3 | 18 | 26.9% | 0 | 2 |
22
 Simon Harmer Bowler |
3 | 10 | 2 | 8.30 | 41.50 | 30.0 | 12 | 20.0% | 0 | 1 |
23
 Bjorn Fortuin Bowler |
4 | 16.2 | 2 | 6.37 | 52.00 | 49.0 | 42 | 42.9% | 0 | 1 |
24
 David Wiese All-rounder |
3 | 10.3 | 2 | 12.10 | 63.50 | 31.5 | 18 | 28.6% | 0 | 1 |
25
 Kwena Maphaka Bowler |
3 | 13.3 | 2 | 10.15 | 68.50 | 40.5 | 22 | 27.2% | 0 | 1 |
26
 Trent Boult Bowler |
4 | 17.2 | 2 | 9.69 | 84.00 | 52.0 | 25 | 24.0% | 0 | 1 |
SA20 Stats Questions
SA20 2025/2026 player and team stats: runs, averages and strike rates, wickets and economy, fielding and Dream11 points, and every side's batting, bowling and fielding. Statz tracks SA20 2025/2026 across the points table, season leaderboards and venue scoring trends, updated after every completed match.
SA20 on Statz
Frequently asked questions
Who scored the most runs in the SA20 2025/2026?
Quinton de Kock (Sunrisers Eastern Cape) with 390 runs in 11 matches, at a strike rate of 148.9.
Who took the most wickets in the SA20 2025/2026?
Ottneil Baartman (Paarl Royals) with 20 wickets at 8.93 an over.
Who hit the most sixes in the SA20 2025/2026?
Dewald Brevis with 30 sixes.