



























Major League Cricket 2023
 USA
Major League Cricket Player Bowling Average 2023
Every player ranked on bowling averages. Sorted on at least 10 overs.
Updated 31 July 2023, after Seattle Orcas vs MI New York
| #Player | M | Overs | Wkts | Econ | Avg | SR | Dots | Dot % | Mdns | Best |
|---|---|---|---|---|---|---|---|---|---|---|
1
  Trent Boult Bowler |
8 | 32 | 22 | 7.13 | 10.36 | 8.7 | 86 | 44.8% | 0 | 4 |
2
 Kagiso Rabada Bowler |
3 | 11.1 | 6 | 6.99 | 13.00 | 11.2 | 30 | 44.8% | 1 | 2 |
3
 Nosthush Kenjige Bowler |
5 | 15.2 | 6 | 5.74 | 14.67 | 15.3 | 37 | 40.2% | 0 | 2 |
4
  Imad Wasim All-rounder |
7 | 24.3 | 10 | 6.24 | 15.30 | 14.7 | 72 | 49.0% | 0 | 2 |
5
  Gerald Coetzee All-rounder |
5 | 15.4 | 8 | 8.04 | 15.75 | 11.8 | 43 | 45.7% | 1 | 4 |
6
  Saurabh Netravalkar Bowler |
6 | 22 | 10 | 7.23 | 15.90 | 13.2 | 56 | 42.4% | 0 | 6 |
7
 Moises Henriques All-rounder |
6 | 11.3 | 5 | 7.48 | 17.20 | 13.8 | 29 | 42.0% | 0 | 3 |
8
 Cameron Gannon Bowler |
7 | 26.4 | 11 | 7.16 | 17.36 | 14.5 | 66 | 41.3% | 0 | 4 |
9
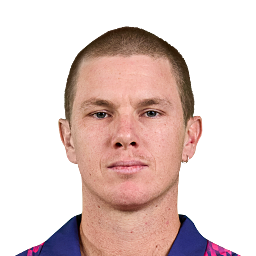  Adam Zampa Bowler |
5 | 19.2 | 9 | 8.12 | 17.44 | 12.9 | 36 | 31.0% | 0 | 3 |
10
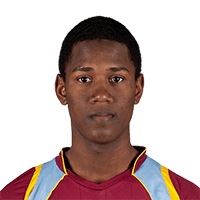 Akeal Hosein Bowler |
6 | 17.1 | 7 | 7.51 | 18.43 | 14.7 | 41 | 39.8% | 0 | 2 |
11
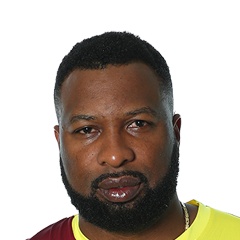 Kieron Pollard All-rounder |
5 | 13.4 | 5 | 7.02 | 19.20 | 16.4 | 26 | 31.7% | 0 | 2 |
12
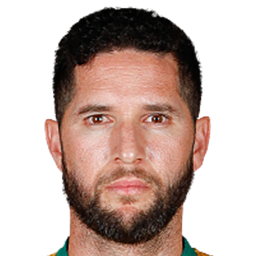 Wayne Parnell Bowler |
6 | 21 | 9 | 8.24 | 19.22 | 14.0 | 51 | 40.5% | 0 | 5 |
13
 Mohammad Mohsin All-rounder |
7 | 21 | 9 | 8.52 | 19.89 | 14.0 | 47 | 37.3% | 0 | 4 |
14
  Liam Plunkett Bowler |
5 | 17.3 | 7 | 8.00 | 20.00 | 15.0 | 35 | 33.3% | 0 | 2 |
15
 Rashid Khan Bowler |
6 | 24.3 | 8 | 6.69 | 20.50 | 18.4 | 68 | 46.3% | 1 | 3 |
16
 Andrew Tye Bowler |
7 | 26.3 | 11 | 8.68 | 20.91 | 14.5 | 54 | 34.0% | 0 | 3 |
17
 Dane Piedt Bowler |
5 | 13 | 4 | 6.69 | 21.75 | 19.5 | 31 | 39.7% | 0 | 1 |
18
 Harmeet Singh Bowler |
7 | 23.4 | 7 | 6.93 | 23.43 | 20.3 | 54 | 38.0% | 0 | 2 |
19
 Marco Jansen All-rounder |
6 | 24.2 | 7 | 6.82 | 23.71 | 20.9 | 71 | 48.6% | 0 | 2 |
20
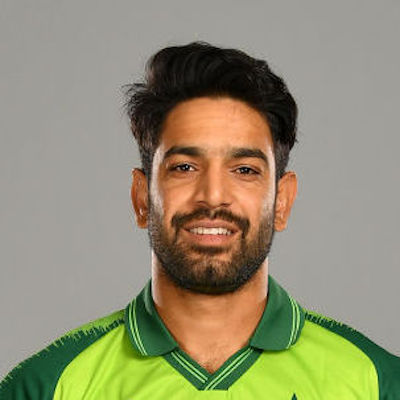 Haris Rauf Bowler |
5 | 21.1 | 7 | 7.94 | 24.00 | 18.1 | 51 | 40.2% | 1 | 3 |
21
 Daniel Sams All-rounder |
5 | 17.3 | 5 | 7.09 | 24.80 | 21.0 | 45 | 42.9% | 0 | 2 |
22
 Rusty Theron Bowler |
7 | 18.4 | 5 | 6.86 | 25.60 | 22.4 | 53 | 47.3% | 0 | 2 |
23
 Dwayne Bravo All-rounder |
4 | 11.2 | 3 | 7.24 | 27.33 | 22.7 | 18 | 26.5% | 0 | 1 |
24
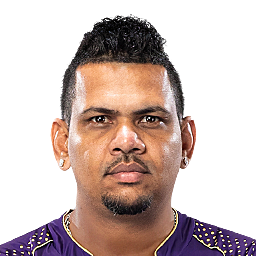 Sunil Narine Bowler |
5 | 20.5 | 4 | 6.14 | 32.00 | 31.3 | 41 | 32.8% | 0 | 1 |
25
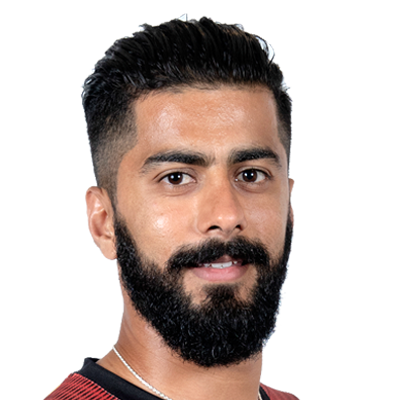 Ali Khan Bowler |
5 | 19.1 | 6 | 10.54 | 33.67 | 19.2 | 42 | 36.5% | 0 | 2 |
26
 Mitchell Santner All-rounder |
7 | 21 | 4 | 7.86 | 41.25 | 31.5 | 36 | 28.6% | 0 | 2 |
27
 Spencer Johnson Bowler |
3 | 11.1 | 2 | 7.79 | 43.50 | 33.5 | 29 | 43.3% | 0 | 1 |
28
 Carmi le Roux Bowler |
5 | 19 | 3 | 7.42 | 47.00 | 38.0 | 49 | 43.0% | 0 | 2 |
29
 Ehsan Adil Bowler |
6 | 18.2 | 3 | 8.18 | 50.00 | 36.7 | 42 | 38.2% | 0 | 2 |
30
 David Wiese All-rounder |
5 | 21.2 | 4 | 9.89 | 52.75 | 32.0 | 33 | 25.8% | 0 | 1 |
31
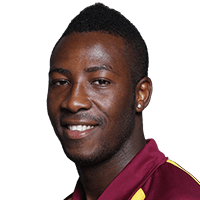 Andre Russell All-rounder |
5 | 11.2 | 2 | 11.03 | 62.50 | 34.0 | 19 | 27.9% | 0 | 1 |
32
 Calvin Savage Keeper |
5 | 16.2 | 2 | 7.90 | 64.50 | 49.0 | 31 | 31.6% | 0 | 1 |
33
 Marcus Stoinis All-rounder |
5 | 21.1 | 2 | 8.03 | 85.00 | 63.5 | 40 | 31.5% | 0 | 1 |
34
 Steven Taylor Batter |
5 | 13 | 1 | 6.62 | 86.00 | 78.0 | 26 | 33.3% | 0 | 1 |
35
 Anrich Nortje Bowler |
6 | 23.5 | 2 | 7.64 | 91.00 | 71.5 | 61 | 42.7% | 0 | 1 |
Major League Cricket Stats Questions
Major League Cricket 2023 player and team stats: runs, averages and strike rates, wickets and economy, fielding and Dream11 points, and every side's batting, bowling and fielding. Statz tracks Major League Cricket 2023 across the points table, season leaderboards and venue scoring trends, updated after every completed match.
Major League Cricket on Statz
Frequently asked questions
Who scored the most runs in the Major League Cricket 2023?
Nicholas Pooran (MI New York) with 388 runs in 8 matches, at a strike rate of 167.2.
Who took the most wickets in the Major League Cricket 2023?
Trent Boult (MI New York) with 22 wickets at 7.13 an over.
Who hit the most sixes in the Major League Cricket 2023?
Nicholas Pooran with 34 sixes.