



























Indian Premier League 2013
 India
Indian Premier League Player Bowling Average 2013
Every player ranked on bowling averages. Sorted on at least 10 overs.
Updated 26 May 2013, after Chennai Super Kings vs Mumbai Indians
| #Player | M | Overs | Wkts | Econ | Avg | SR | Dots | Dot % | Mdns | Best |
|---|---|---|---|---|---|---|---|---|---|---|
1
  Sandeep Sharma Bowler |
3 | 12.1 | 8 | 6.82 | 10.38 | 9.1 | 35 | 47.9% | 1 | 3 |
2
  Sunil Narine Bowler |
8 | 32 | 14 | 5.38 | 12.29 | 13.7 | 81 | 42.2% | 0 | 4 |
3
  Harbhajan Singh Bowler |
9 | 35 | 15 | 5.46 | 12.73 | 14.0 | 90 | 42.9% | 0 | 3 |
4
  Amit Mishra Bowler |
8 | 32.1 | 12 | 5.35 | 14.33 | 16.1 | 82 | 42.5% | 0 | 3 |
5
  Dwayne Bravo All-rounder |
10 | 41.1 | 22 | 7.89 | 14.77 | 11.2 | 81 | 32.8% | 0 | 4 |
6
 Albie Morkel All-rounder |
5 | 14.3 | 6 | 6.21 | 15.00 | 14.5 | 39 | 44.8% | 0 | 3 |
7
 Dale Steyn Bowler |
8 | 32.4 | 11 | 5.14 | 15.27 | 17.8 | 104 | 53.1% | 1 | 3 |
8
  RP Singh Bowler |
6 | 21.4 | 10 | 7.11 | 15.40 | 13.0 | 55 | 42.3% | 0 | 3 |
9
 Jacques Kallis All-rounder |
8 | 27 | 10 | 6.37 | 17.20 | 16.2 | 70 | 43.2% | 0 | 3 |
10
 Ravi Rampaul Bowler |
4 | 14.1 | 5 | 6.21 | 17.60 | 17.0 | 43 | 50.6% | 1 | 2 |
11
 Vinay Kumar Bowler |
8 | 29.3 | 12 | 7.25 | 17.83 | 14.8 | 66 | 37.3% | 0 | 3 |
12
  James Faulkner All-rounder |
8 | 32.3 | 13 | 7.14 | 17.85 | 15.0 | 82 | 42.1% | 1 | 5 |
13
 Mitchell Johnson Bowler |
9 | 35.4 | 15 | 7.51 | 17.87 | 14.3 | 105 | 49.1% | 0 | 3 |
14
 Dhawal Kulkarni Bowler |
4 | 17 | 7 | 7.41 | 18.00 | 14.6 | 48 | 47.1% | 0 | 3 |
15
 Stuart Binny All-rounder |
9 | 17.4 | 5 | 5.21 | 18.40 | 21.2 | 50 | 47.2% | 0 | 2 |
16
 Mohit Sharma Bowler |
8 | 27.5 | 10 | 7.15 | 19.90 | 16.7 | 84 | 50.3% | 0 | 2 |
17
 Pragyan Ojha Bowler |
8 | 28 | 11 | 7.82 | 19.91 | 15.3 | 62 | 36.9% | 0 | 3 |
18
 Shanthakumaran Sreesanth Bowler |
3 | 12.5 | 4 | 6.23 | 20.00 | 19.3 | 40 | 51.9% | 2 | 2 |
19
  Rahul Sharma Bowler |
5 | 19 | 6 | 6.32 | 20.00 | 19.0 | 42 | 36.8% | 0 | 2 |
20
 Karn Sharma Bowler |
6 | 18.1 | 6 | 6.61 | 20.00 | 18.2 | 45 | 41.3% | 0 | 2 |
21
 Siddharth Trivedi Bowler |
9 | 32.4 | 10 | 6.15 | 20.10 | 19.6 | 86 | 43.9% | 1 | 3 |
22
 Thisara Perera All-rounder |
8 | 31.1 | 11 | 7.25 | 20.55 | 17.0 | 76 | 40.6% | 0 | 3 |
23
 Kieron Pollard All-rounder |
9 | 12.3 | 5 | 8.32 | 20.80 | 15.0 | 21 | 28.0% | 0 | 2 |
24
 Kevon Cooper Bowler |
7 | 27.5 | 10 | 7.98 | 22.20 | 16.7 | 53 | 31.7% | 0 | 3 |
25
 Mitchell Marsh All-rounder |
4 | 10.5 | 3 | 6.18 | 22.33 | 21.7 | 21 | 32.3% | 0 | 2 |
26
 Azhar Mahmood All-rounder |
5 | 20.2 | 7 | 7.92 | 23.00 | 17.4 | 43 | 35.2% | 0 | 3 |
27
 Lasith Malinga Bowler |
9 | 35.2 | 10 | 6.54 | 23.10 | 21.2 | 85 | 40.1% | 0 | 2 |
|
28
A
Ajit Chandila All-rounder
|
5 | 14 | 4 | 6.79 | 23.75 | 21.0 | 37 | 44.0% | 0 | 2 |
29
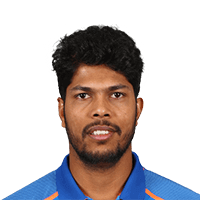  Umesh Yadav Bowler |
8 | 31 | 11 | 8.52 | 24.00 | 16.9 | 71 | 38.2% | 0 | 4 |
30
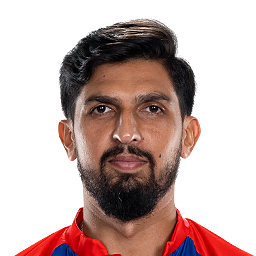 Ishant Sharma Bowler |
7 | 28.3 | 8 | 6.74 | 24.00 | 21.4 | 78 | 45.6% | 1 | 3 |
31
 Rajat Bhatia All-rounder |
8 | 25.1 | 7 | 7.07 | 25.43 | 21.6 | 35 | 23.2% | 0 | 2 |
32
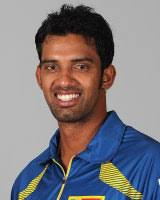 Sachithra Senanayake All-rounder |
7 | 28.3 | 7 | 6.35 | 25.86 | 24.4 | 67 | 39.2% | 1 | 2 |
33
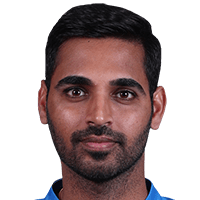 Bhuvneshwar Kumar Bowler |
8 | 28.3 | 7 | 6.39 | 26.00 | 24.4 | 81 | 47.4% | 1 | 3 |
34
 Murali Kartik Bowler |
4 | 14.4 | 4 | 7.16 | 26.25 | 22.0 | 30 | 34.1% | 0 | 1 |
35
 Yuvraj Singh All-rounder |
6 | 11.1 | 3 | 7.16 | 26.67 | 22.3 | 19 | 28.4% | 0 | 2 |
36
 Manpreet Gony Bowler |
4 | 14.2 | 4 | 7.88 | 28.25 | 21.5 | 37 | 43.0% | 0 | 2 |
37
 Irfan Pathan Bowler |
8 | 30 | 7 | 6.63 | 28.43 | 25.7 | 83 | 46.1% | 1 | 2 |
38
 Shane Watson All-rounder |
9 | 21.4 | 5 | 6.60 | 28.60 | 26.0 | 62 | 47.7% | 0 | 3 |
39
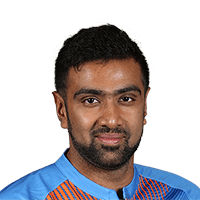 Ravichandran Ashwin Bowler |
10 | 36.4 | 8 | 6.30 | 28.88 | 27.5 | 73 | 33.2% | 0 | 2 |
40
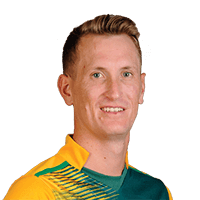 Chris Morris All-rounder |
8 | 27.3 | 8 | 8.44 | 29.00 | 20.6 | 58 | 35.2% | 0 | 3 |
41
 Shahbaz Nadeem Bowler |
7 | 27.2 | 5 | 5.78 | 31.60 | 32.8 | 62 | 37.8% | 1 | 2 |
42
 Ashish Nehra Bowler |
4 | 15.3 | 4 | 8.19 | 31.75 | 23.3 | 32 | 34.4% | 0 | 2 |
43
 Ashok Dinda Bowler |
7 | 25.4 | 7 | 8.69 | 31.86 | 22.0 | 56 | 36.4% | 0 | 2 |
44
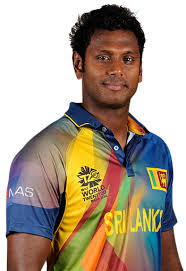 Angelo Mathews All-rounder |
7 | 19.2 | 4 | 7.03 | 34.00 | 29.0 | 38 | 32.8% | 0 | 3 |
45
 Lakshmipathy Balaji Bowler |
7 | 28.2 | 6 | 7.41 | 35.00 | 28.3 | 67 | 39.4% | 0 | 2 |
46
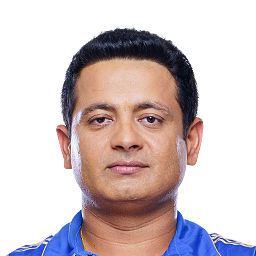 Piyush Chawla All-rounder |
8 | 31.2 | 6 | 6.99 | 36.50 | 31.3 | 65 | 34.6% | 0 | 2 |
47
 Parvinder Awana Bowler |
8 | 30.5 | 7 | 8.30 | 36.57 | 26.4 | 69 | 37.3% | 0 | 2 |
48
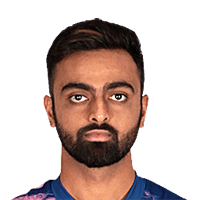 Jaydev Unadkat Bowler |
8 | 30.3 | 6 | 7.64 | 38.83 | 30.5 | 59 | 32.2% | 0 | 2 |
49
 Morne Morkel Bowler |
5 | 20.5 | 4 | 7.78 | 40.50 | 31.3 | 51 | 40.8% | 0 | 2 |
50
 Ravindra Jadeja All-rounder |
10 | 20.2 | 4 | 8.61 | 43.75 | 30.5 | 37 | 30.3% | 0 | 3 |
51
 Praveen Kumar Bowler |
8 | 31.1 | 4 | 6.45 | 50.25 | 46.8 | 87 | 46.5% | 0 | 2 |
52
 Muttiah Muralitharan Bowler |
4 | 16.1 | 2 | 7.92 | 64.00 | 48.5 | 33 | 34.0% | 0 | 1 |
53
 Dirk Nannes Bowler |
4 | 17.1 | 2 | 8.21 | 70.50 | 51.5 | 40 | 38.8% | 0 | 1 |
54
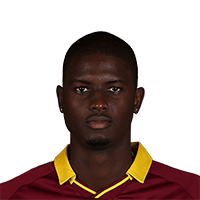 Jason Holder All-rounder |
3 | 12.4 | 0 | 7.89 | - | - | 26 | 34.2% | 0 | 0 |
Indian Premier League Stats Questions
Indian Premier League 2013 player and team stats: runs, averages and strike rates, wickets and economy, fielding and Dream11 points, and every side's batting, bowling and fielding. Statz tracks Indian Premier League 2013 across the points table, season leaderboards and venue scoring trends, updated after every completed match.
Indian Premier League on Statz
Frequently asked questions
Who scored the most runs in the Indian Premier League 2013?
Michael Hussey (Chennai Super Kings) with 733 runs in 17 matches, at a strike rate of 129.5.
Who took the most wickets in the Indian Premier League 2013?
Dwayne Bravo (Chennai Super Kings) with 32 wickets at 7.61 an over.
Who hit the most sixes in the Indian Premier League 2013?
Chris Gayle with 51 sixes.