




























International League T20 2025
 United Arab Emirates
International League T20 Player Bowling Average 2025
Every player ranked on bowling averages. Sorted on at least 10 overs.
Updated 9 February 2025, after Dubai Capitals vs Desert Vipers
| #Player | M | Overs | Wkts | Econ | Avg | SR | Dots | Dot % | Mdns | Best |
|---|---|---|---|---|---|---|---|---|---|---|
1
  Aayan Khan All-rounder |
8 | 17 | 10 | 6.18 | 10.50 | 10.2 | 40 | 39.2% | 0 | 4 |
2
  Muhammad Rohid Khan Bowler |
5 | 19.4 | 10 | 7.12 | 14.00 | 11.8 | 49 | 41.5% | 0 | 3 |
3
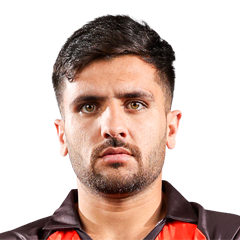 Fazalhaq Farooqi Bowler |
11 | 43.4 | 21 | 7.19 | 14.95 | 12.5 | 108 | 41.2% | 0 | 5 |
4
 Dan Mousley Batter |
5 | 10.2 | 5 | 7.26 | 15.00 | 12.4 | 25 | 40.3% | 0 | 2 |
5
 Blessing Muzarabani Bowler |
10 | 39 | 16 | 6.59 | 16.06 | 14.6 | 108 | 46.2% | 1 | 3 |
6
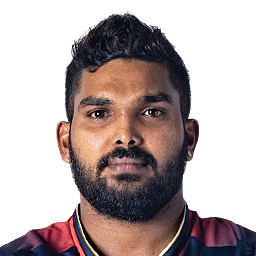  Wanindu Hasaranga All-rounder |
9 | 34.2 | 12 | 5.83 | 16.67 | 17.2 | 94 | 45.6% | 0 | 3 |
7
  Jason Holder All-rounder |
10 | 41.1 | 17 | 7.38 | 17.88 | 14.5 | 93 | 37.7% | 1 | 4 |
8
 Lockie Ferguson Bowler |
8 | 28.3 | 11 | 7.02 | 18.18 | 15.5 | 75 | 43.9% | 0 | 3 |
9
  Gulbadin Naib All-rounder |
12 | 23.3 | 11 | 8.64 | 18.45 | 12.8 | 44 | 31.2% | 0 | 3 |
10
 Mark Adair Bowler |
10 | 39 | 13 | 6.49 | 19.46 | 18.0 | 104 | 44.4% | 2 | 2 |
11
 Qais Ahmad Bowler |
4 | 15.1 | 6 | 7.98 | 20.17 | 15.2 | 29 | 31.9% | 0 | 4 |
12
 Alzarri Joseph Bowler |
10 | 40.1 | 16 | 8.39 | 21.06 | 15.1 | 95 | 39.4% | 1 | 3 |
13
 Kyle Mayers All-rounder |
10 | 16.1 | 6 | 8.10 | 21.83 | 16.2 | 45 | 46.4% | 0 | 3 |
14
 Dushmantha Chameera Bowler |
9 | 33.2 | 13 | 8.55 | 21.92 | 15.4 | 80 | 40.0% | 0 | 3 |
15
 Mohammad Amir Bowler |
11 | 41.4 | 14 | 7.78 | 23.14 | 17.9 | 112 | 44.8% | 0 | 4 |
16
  Adam Zampa Bowler |
5 | 19.1 | 6 | 7.51 | 24.00 | 19.2 | 38 | 33.0% | 0 | 3 |
17
 David Payne Bowler |
9 | 33.2 | 10 | 7.23 | 24.10 | 20.0 | 87 | 43.5% | 1 | 2 |
18
 Olly Stone Bowler |
4 | 15 | 5 | 8.33 | 25.00 | 18.0 | 45 | 50.0% | 1 | 2 |
19
 Adam Milne Bowler |
12 | 45.5 | 14 | 7.64 | 25.00 | 19.6 | 120 | 43.6% | 0 | 3 |
|
20
K
Khuzaima Tanveer Bowler
|
7 | 21.5 | 7 | 8.24 | 25.71 | 18.7 | 48 | 36.6% | 0 | 4 |
21
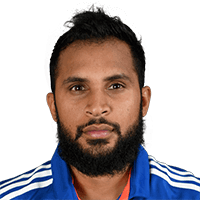 Adil Rashid Bowler |
3 | 12.1 | 3 | 6.58 | 26.67 | 24.3 | 22 | 30.1% | 0 | 2 |
22
 Rohan Mustafa Batter |
12 | 11 | 3 | 7.36 | 27.00 | 22.0 | 16 | 24.2% | 0 | 2 |
23
 Obed McCoy Bowler |
11 | 41 | 13 | 8.73 | 27.54 | 18.9 | 100 | 40.7% | 0 | 3 |
24
 Harmeet Singh Bowler |
5 | 13.1 | 3 | 6.30 | 27.67 | 26.3 | 26 | 32.9% | 0 | 1 |
25
 Zahoor Khan Bowler |
7 | 22.2 | 5 | 6.63 | 29.60 | 26.8 | 49 | 36.6% | 0 | 2 |
26
 David Willey All-rounder |
10 | 40 | 8 | 6.03 | 30.13 | 30.0 | 113 | 47.1% | 0 | 3 |
27
 Romario Shepherd All-rounder |
10 | 10.3 | 3 | 9.05 | 31.67 | 21.0 | 24 | 38.1% | 0 | 2 |
28
 Daniel Worrall Bowler |
6 | 22.3 | 5 | 7.60 | 34.20 | 27.0 | 68 | 50.4% | 1 | 2 |
29
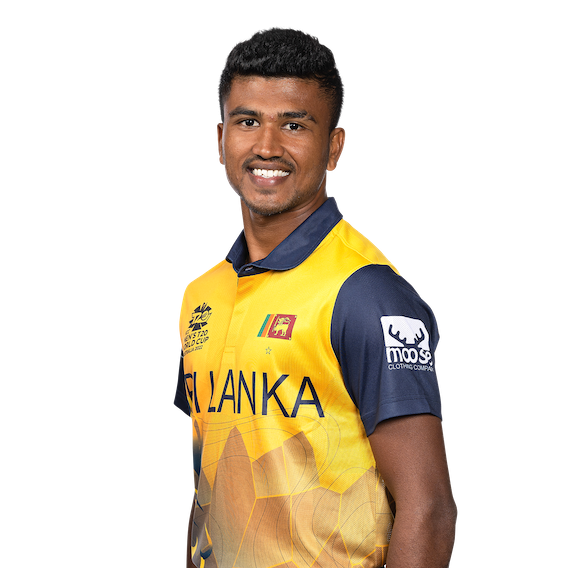 Dilshan Madushanka Bowler |
7 | 24.2 | 7 | 9.90 | 34.43 | 20.9 | 47 | 32.2% | 0 | 2 |
30
 Nathan Sowter All-rounder |
6 | 22 | 6 | 9.77 | 35.83 | 22.0 | 35 | 26.5% | 0 | 3 |
|
31
F
Farhan Khan All-rounder
|
7 | 17 | 4 | 8.82 | 37.50 | 25.5 | 40 | 39.2% | 0 | 1 |
32
 Tim Southee Bowler |
12 | 44.3 | 10 | 8.47 | 37.70 | 26.7 | 110 | 41.2% | 0 | 3 |
33
 Sikandar Raza All-rounder |
12 | 35.2 | 7 | 7.78 | 39.29 | 30.3 | 66 | 31.1% | 0 | 2 |
|
34
I
Ibrar Ahmad All-rounder
|
7 | 16.5 | 4 | 9.56 | 40.25 | 25.3 | 25 | 24.8% | 0 | 2 |
35
 Waqar Salamkheil Bowler |
10 | 31.2 | 6 | 8.17 | 42.67 | 31.3 | 59 | 31.4% | 0 | 1 |
36
 Zahir Khan Bowler |
6 | 18.2 | 4 | 10.36 | 47.50 | 27.5 | 29 | 26.4% | 0 | 3 |
37
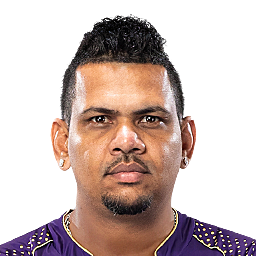 Sunil Narine Bowler |
10 | 41.2 | 5 | 5.98 | 49.40 | 49.6 | 88 | 35.5% | 0 | 2 |
38
 Daniel Lawrence All-rounder |
13 | 11.2 | 2 | 8.74 | 49.50 | 34.0 | 18 | 26.5% | 0 | 1 |
39
 Ali Khan Bowler |
6 | 19.2 | 4 | 10.60 | 51.25 | 29.0 | 25 | 21.6% | 0 | 2 |
40
 Tymal Mills Bowler |
4 | 16.2 | 3 | 9.49 | 51.67 | 32.7 | 32 | 32.7% | 0 | 1 |
41
 Sam Curran All-rounder |
13 | 46.2 | 7 | 8.20 | 54.29 | 39.7 | 89 | 32.0% | 0 | 3 |
42
 Ashton Agar Bowler |
7 | 22.2 | 3 | 7.61 | 56.67 | 44.7 | 43 | 32.1% | 0 | 1 |
|
43
S
Shahid Bhutta Bowler
|
3 | 10.5 | 2 | 10.98 | 59.50 | 32.5 | 18 | 27.7% | 0 | 1 |
44
 Haider Ali Bowler |
10 | 23 | 2 | 6.78 | 78.00 | 69.0 | 45 | 32.6% | 0 | 1 |
45
 Tom Curran All-rounder |
5 | 20 | 2 | 8.90 | 89.00 | 60.0 | 36 | 30.0% | 0 | 1 |
46
 Luke Wood All-rounder |
4 | 13.2 | 1 | 7.58 | 101.00 | 80.0 | 32 | 40.0% | 0 | 1 |
47
 Scott Kuggeleijn All-rounder |
4 | 10.2 | 1 | 11.13 | 115.00 | 62.0 | 15 | 24.2% | 0 | 1 |
48
 Akeal Hosein Bowler |
10 | 30 | 2 | 7.73 | 116.00 | 90.0 | 65 | 36.1% | 1 | 1 |
International League T20 Stats Questions
International League T20 2025 player and team stats: runs, averages and strike rates, wickets and economy, fielding and Dream11 points, and every side's batting, bowling and fielding. Statz tracks International League T20 2025 across the points table, season leaderboards and venue scoring trends, updated after every completed match.
International League T20 on Statz
Frequently asked questions
Who scored the most runs in the International League T20 2025?
Shai Hope (Dubai Capitals) with 527 runs in 12 matches, at a strike rate of 124.3.
Who took the most wickets in the International League T20 2025?
Fazalhaq Farooqi (MI Emirates) with 21 wickets at 7.19 an over.
Who hit the most sixes in the International League T20 2025?
Johnson Charles with 25 sixes.