How to Use Statz.ai’s Predicted League Tables
Introduction
Our Predicted League Table page is a powerful tool for identifying value in league position betting markets. We have combined advanced statistical modelling with real-time bet365 odds, so you can spot opportunities where our projections differ significantly from bookmaker expectations.
Where to Find Predicted League Tables
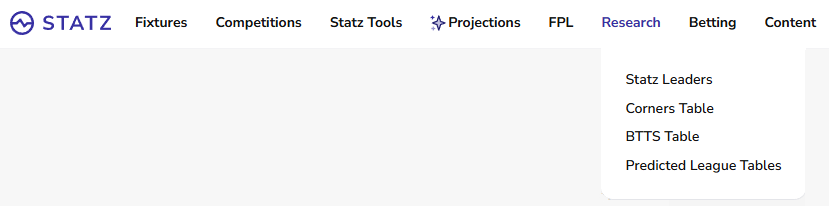
From our homepage, click the “Research” tab in the top menu bar and you will find “Predicted League Tables” as shown in the image below.
Understanding the Model
Our projection model has three key components:
Base Model: Poisson regression analysing historical attack and defence strengths from the last 30 games, weighted towards more recent results.
Adjustments: Factors including wage bills, betting odds, and transfer market intelligence are also taken into account.
Shock Factor: Individual team variance based on expected versus actual performance over the last 30 games.
At the start of the season and after each set of games, the model runs 10,000 simulations of all remaining fixtures to generate probability distributions for each team’s final league position.
How to Use and Read the Table
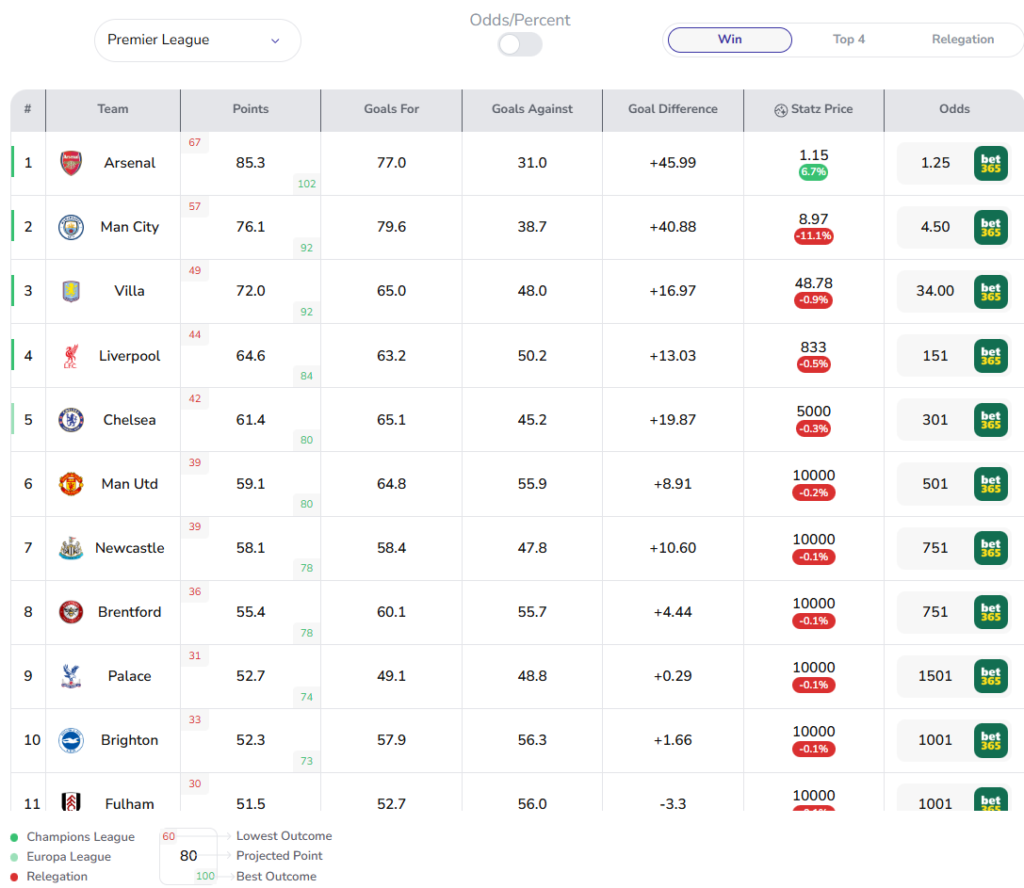
By default, a user will land on the predicted table for the Premier League, with odds relating to each team’s likelihood of winning the league. However, you can change to your preferred league using the dropdown and, depending on which league is chosen, then toggle between Win %, Top 4 Finish %, Relegation % etc.
Each row shows a team’s projected season outcome with the following columns:
- Points: Average points total at season’s end amongst all simulations. The small red/green numbers show each team’s lowest/highest point total across all simulations.
- Goals For/Against/Difference: Average projected goal statistics.
- Statz Price: Our model’s implied odds for the team finishing in a specific position. The green/red percent pill under our implied price shows which selection we find value.
- Odds: Current bet365 odds for the team finishing in a specific position.
Odds/Percent Toggle
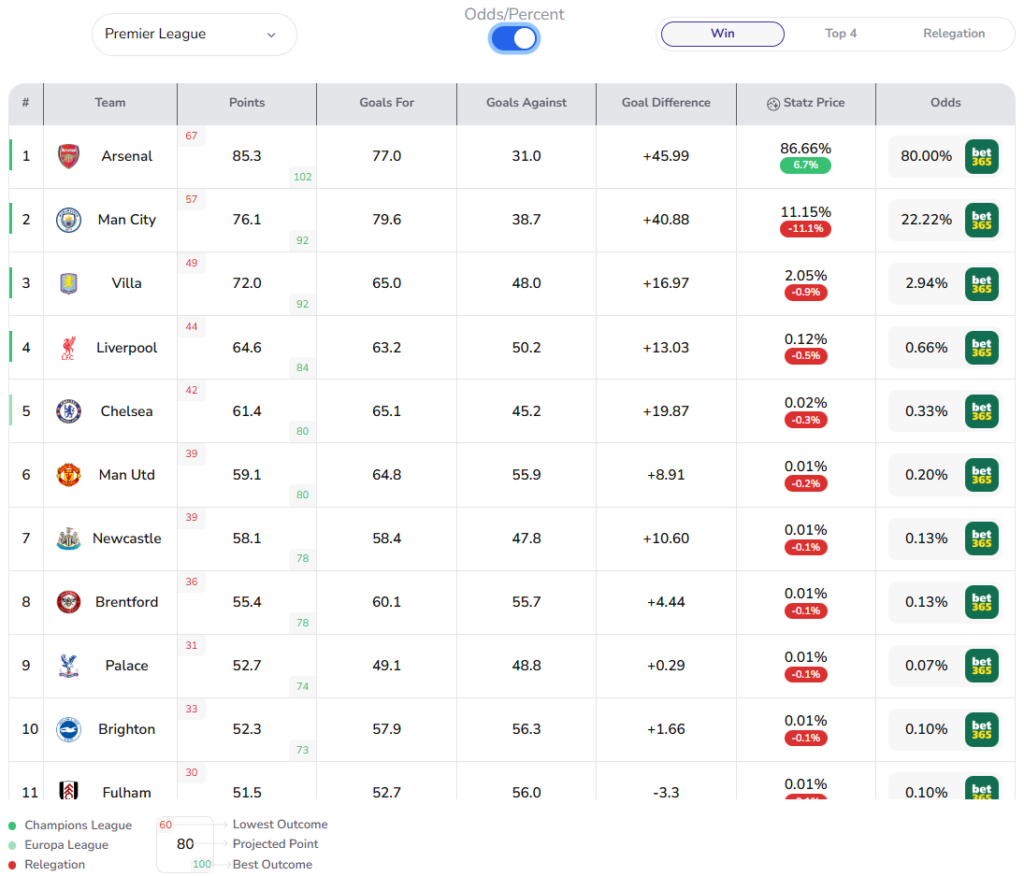
To better visualise the difference in our price to bet365 odds you may want to switch to percent table view, which converts odds to percentages. For example, in the table below, our model simulates that Arsenal has a 86.66% chance of winning the league, where as bet365’s odds imply that they only have a 80.00% chance.
Finding Value Bets
The key to using this page is comparing our Statz Price against the bet365 odds. Here’s how to spot value:
Green Indicators = Value Opportunities
When you see green highlighting under our Statz Price, this indicates our model believes the probability is higher than what the bookmaker odds suggest, which would suggest a ‘value bet’. What’s great about this page is that we have integrated bet365 odds so that in one click you can be sent to bet365 with your selection pre-loaded in a bet slip!
Red Indicators = Overpriced
Red highlighting suggests the bookmaker odds are shorter than what our projections warrant, indicating potential overvaluation.
Practical Examples from the Table
Looking at the current Premier League projections:
Arsenal: Our model’s simulations give the league leaders a price of 1.15 vs bet365 odds of 1.25. As the odds are higher this suggests value in backing Arsenal for the title, with them lifting the trophy in 86.7% of our simulations.
Man City: Unsurprisingly this means that our model does not show value for Man City with our price being 8.97 vs bet365’s 4.50. The bookmaker odds being less than our models, indicates City may be overvalued in the title market. However, they still lift the trophy in 11.1% of our simulations – Still a chance City fans!
Tips for Using the Page
- Toggle between markets: Use the Win/Top 4/Relegation tabs to explore different betting angles
- Check the Odds/Percent toggle: Switch to percentage view for easier probability comparison
- Consider the projections holistically: Don’t just look at odds differences—consider the projected points, goals, and goal difference to understand the complete projected picture
- Compare across leagues: Use the league dropdown to analyze value across different competitions
- Monitor regularly: Projections and odds change throughout the season as form develops and the model updates
Check out the page here!