Menu

Account

Create a free account Go Pro

Already have an account? Log in

Next SA20 match Joburg Super KingsJoburg Super Kings (H)
SA20 - Mon 18 Jan, 15:30 Their economy Preview

Paarl Royals SA20 Cricket Economy Rate Stats

How many runs an over Paarl Royals concede, and who bowls tightest, game by game

Updated , after the Sunrisers Eastern Cape game

Player Avg Hit %
SA20 23 Jan 26 Sunrisers Eastern CapeH 114/7117/3
SA20 22 Jan 26 Joburg Super KingsH 210/5174/8
SA20 19 Jan 26 Joburg Super KingsH 122166/5
SA20 13 Jan 26 Durban's Super GiantsH 191/4186/5
SA20 10 Jan 26 Pretoria CapitalsH 117/6138/9
SA20 2 Jan 26 MI Cape TownH 181/3180/8
SA20 27 Dec 25 Sunrisers Eastern CapeH 49186/4
SA20 6 Feb 25 Sunrisers Eastern CapeH 175/4177/2
SA20 27 Jan 25 Durban's Super GiantsH 147/4143/7
SA20 25 Jan 25 Pretoria CapitalsH 140/4129/7
SA20 20 Jan 25 Joburg Super KingsH 150/4146/6
SA20 15 Jan 25 MI Cape TownH 159/4158/4
SA20 11 Jan 25 Sunrisers Eastern CapeH 176/1175/5
SA20 7 Feb 24 Joburg Super KingsH 138139/1
SA20 2 Feb 24 Sunrisers Eastern CapeH 164/7208/4
SA20 26 Jan 24 Durban's Super GiantsH 133190/3
SA20 21 Jan 24 MI Cape TownH 162/3103
SA20 17 Jan 24 Joburg Super KingsH 135/3134
SA20 12 Jan 24 Pretoria CapitalsH 160/7133/7
SA20 22 Jan 23 Pretoria CapitalsH 162/4158/6
SA20 21 Jan 23 MI Cape TownH 129/6142/9
SA20 19 Jan 23 Sunrisers Eastern CapeH 127/7131/5
SA20 17 Jan 23 Durban's Super GiantsH 169/6159/8
SA20 13 Jan 23 Joburg Super KingsH 82/381
Paarl Royals total 7.97 10.038.708.309.306.909.009.309.167.156.457.307.908.7510.4310.409.505.626.766.657.907.107.157.954.67
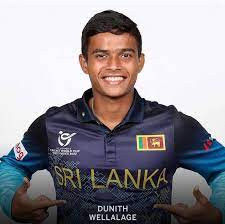
Dunith Wellalage Paarl Royals D. WellalageBowler, 5 bowled 5.89 80%4/5 8.673-26-1 6.004-24-1 4.004-16-1 7.254-29-0 4.254-17-0
Wihan Lubbe Paarl Royals W. LubbeAll-rounder, 8 bowled 6.08 75%6/8 -DNB 3.502-7-1 6.001-6-0 -DNB 6.502-13-0 6.001-6-1 13.001-13-0 4.502-9-0 -DNB 13.001-13-0 4.003-12-0
Bjorn Fortuin Paarl Royals B. FortuinBowler, 24 bowled 6.48 88%21/24 6.504-26-2 8.004-32-1 5.673-17-1 8.004-32-1 5.504-22-0 8.003-24-0 8.004-32-1 8.754-35-0 5.004-20-2 5.004-20-2 5.504-22-2 8.004-32-0 6.004-24-0 8.754-35-0 8.003-24-0 8.004-32-1 3.754-15-3 5.673-17-0 8.333-25-0 8.004-32-1 5.504-22-2 5.004-20-3 3.504-14-3 4.004-16-3
Mujeeb Ur Rahman Paarl Royals M. Ur RahmanBowler, 10 bowled 6.83 70%7/10 5.504-22-2 5.004-20-0 8.504-34-0 8.254-33-0 9.754-39-0 6.504-26-1 4.254-17-2 7.004-28-1 6.754-27-2 6.754-27-2
A Paarl Royals A. TribeKeeper, 4 bowled 7.00 50%2/4 7.002-14-0 -DNB -DNB 8.502-17-0 -DNB 10.001-10-0 1.001-1-0
Sikandar Raza Paarl Royals S. RazaAll-rounder, 6 bowled 7.05 50%3/6 9.002-18-0 6.504-26-1 9.003-27-1 9.673-29-0 3.504-14-2 6.754-27-3
Tabraiz Shamsi Paarl Royals T. ShamsiBowler, 11 bowled 7.20 73%8/11 10.754-43-1 11.003-33-1 7.504-30-0 2.754-11-2 6.754-27-1 5.504-22-1 7.254-29-1 6.754-27-2 5.504-22-0 10.004-40-1 4.001-4-1
Joe Root Paarl Royals J. RootBatter, 4 bowled 7.50 75%3/4 11.003-33-0 8.004-32-2 4.004-16-1 8.003-24-1 -DNB
Lungi Ngidi Paarl Royals L. NgidiBowler, 11 bowled 7.51 64%7/11 10.504-42-0 11.254-45-0 11.504-46-1 7.803.2-26-2 4.433.5-17-3 5.754-23-1 4.754-19-1 7.254-29-2 7.754-31-2 8.254-33-0 3.254-13-1
Ferisco Adams Paarl Royals F. AdamsAll-rounder, 4 bowled 7.71 50%2/4 9.504-38-2 7.754-31-2 8.333-25-0 4.673-14-2
Obed McCoy Paarl Royals O. McCoyBowler, 6 bowled 8.70 33%2/6 9.002-18-0 10.504-42-0 9.754-39-1 6.003-18-2 10.333-31-2 6.504-26-1
Andile Phehlukwayo Paarl Royals A. PhehlukwayoAll-rounder, 6 bowled 8.82 33%2/6 10.002-20-0 -DNB 10.001-10-0 12.003-36-0 9.333-28-1 6.754-27-1 7.254-29-2
Kwena Maphaka Paarl Royals K. MaphakaBowler, 5 bowled 9.18 20%1/5 8.703.2-29-1 5.504-22-2 14.502-29-0 11.673-35-0 8.754-35-2
Hardus Viljoen Paarl Royals H. ViljoenBowler, 3 bowled 9.29 33%1/3 16.001-16-0 6.004-24-3 12.502-25-2
Daniel Lawrence Paarl Royals D. LawrenceAll-rounder, 5 bowled 9.44 40%2/5 21.001-21-0 13.001-13-0 6.004-24-0 8.001-8-0 9.502-19-2
Evan Jones Paarl Royals E. JonesAll-rounder, 6 bowled 9.98 17%1/6 12.754-51-2 8.333-25-1 11.002-22-0 10.673-32-0 8.004-32-4 9.002.2-21-3
N Paarl Royals N. MokoenaBatter, 6 bowled 10.29 17%1/6 10.333-31-1 9.333-28-1 14.004-56-2 8.254-33-1 7.254-29-1 13.003-39-0
Dayyaan Galiem Paarl Royals D. GaliemAll-rounder, 5 bowled 10.55 0%0/5 9.002-18-0 13.001-13-0 9.502-19-1 10.002-20-1 11.504-46-0
Ottneil Baartman Paarl Royals O. BaartmanBowler, 5 bowled 11.00 0%0/5 11.001-11-1 11.754-47-2 9.003-27-0 12.754-51-4 10.004-40-2
Fabian Allen Paarl Royals F. AllenAll-rounder, 1 bowled 3.00 100%1/1 -DNB 3.001-3-0 -DNB
Mitchell Owen Paarl Royals M. OwenAll-rounder, 1 bowled 8.00 100%1/1 8.001-8-0
N Paarl Royals N. PeterBowler, 1 bowled 8.25 0%0/1 8.254-33-0
Delano Potgieter Paarl Royals D. PotgieterAll-rounder, 2 bowled 9.83 0%0/2 -DNB 10.502-21-0 -DNB -DNB 9.504-38-1
C Paarl Royals C. YusufAll-rounder, 2 bowled 9.88 50%1/2 13.712.2-32-0 7.203.2-24-0
Waqar Salamkheil Paarl Royals W. SalamkheilBowler, 1 bowled 10.50 0%0/1 10.504-42-2
Lhuan-dre Pretorius Paarl Royals L. PretoriusKeeper, 1 bowled 16.50 0%0/1 16.500.4-11-0 -DNB -DNB -DNB -DNB -DNB -DNB -DNB -DNB -DNB -DNB -DNB -DNB
A green cell is at or under the line. The line under an economy rate is the bowler's overs, runs and wickets; DNB did not bowl.

Paarl Royals Team Economy

Line8
Avg7.977.77
Hit54%
10.03
8.70
8.30
9.30
6.90
9.00
9.30
9.16
7.15
6.45
7.30
7.90
8.75
10.43
10.40
9.50
5.62
6.76
6.65
7.90
7.10
7.15
7.95
4.67
5.70
10.50
6.72
9.55
5.85
9.05
4.14
8.75
7.41
7.00
7.83
8.37
9.43
7.33
8.20
6.82
8.10
9.53
8.00
8.24
6.45
6.35
8.45
7.81
SA20 23 Jan 26 Sunrisers Eastern CapeH 114/7117/3
SA20 22 Jan 26 Joburg Super KingsH 210/5174/8
SA20 19 Jan 26 Joburg Super KingsH 122166/5
SA20 13 Jan 26 Durban's Super GiantsH 191/4186/5
SA20 10 Jan 26 Pretoria CapitalsH 117/6138/9
SA20 2 Jan 26 MI Cape TownH 181/3180/8
SA20 27 Dec 25 Sunrisers Eastern CapeH 49186/4
SA20 6 Feb 25 Sunrisers Eastern CapeH 175/4177/2
SA20 27 Jan 25 Durban's Super GiantsH 147/4143/7
SA20 25 Jan 25 Pretoria CapitalsH 140/4129/7
SA20 20 Jan 25 Joburg Super KingsH 150/4146/6
SA20 15 Jan 25 MI Cape TownH 159/4158/4
SA20 11 Jan 25 Sunrisers Eastern CapeH 176/1175/5
SA20 7 Feb 24 Joburg Super KingsH 138139/1
SA20 2 Feb 24 Sunrisers Eastern CapeH 164/7208/4
SA20 26 Jan 24 Durban's Super GiantsH 133190/3
SA20 21 Jan 24 MI Cape TownH 162/3103
SA20 17 Jan 24 Joburg Super KingsH 135/3134
SA20 12 Jan 24 Pretoria CapitalsH 160/7133/7
SA20 22 Jan 23 Pretoria CapitalsH 162/4158/6
SA20 21 Jan 23 MI Cape TownH 129/6142/9
SA20 19 Jan 23 Sunrisers Eastern CapeH 127/7131/5
SA20 17 Jan 23 Durban's Super GiantsH 169/6159/8
SA20 13 Jan 23 Joburg Super KingsH 82/381

Paarl Royals Economy Match by Match

The last 24 SA20 matches and how often Paarl Royals kept under the line

Line8
OpponentResultForAg <8
Avg 8.027.73 54%
Sunrisers Eastern CapeSunrisers Eastern Cape (H)23 Jan Lby 7 wickets 10.035.70
Joburg Super KingsJoburg Super Kings (H)22 Jan Wby 36 runs 8.7010.50
Joburg Super KingsJoburg Super Kings (H)19 Jan Lby 44 runs 8.306.72
Durban's Super GiantsDurban's Super Giants (H)13 Jan Wby 6 wickets 9.309.55
Pretoria CapitalsPretoria Capitals (H)10 Jan Lby 21 runs 6.905.85
MI Cape TownMI Cape Town (H)2 Jan Wby 1 run 9.009.05
Sunrisers Eastern CapeSunrisers Eastern Cape (H)27 Dec 2025 Lby 137 runs 9.304.14
Sunrisers Eastern CapeSunrisers Eastern Cape (H)6 Feb 2025 Lby 8 wickets 9.168.75
Durban's Super GiantsDurban's Super Giants (H)27 Jan 2025 Wby 6 wickets 7.157.41
Pretoria CapitalsPretoria Capitals (H)25 Jan 2025 Wby 11 runs 6.457.00
Joburg Super KingsJoburg Super Kings (H)20 Jan 2025 Wby 6 wickets 7.307.83
MI Cape TownMI Cape Town (H)15 Jan 2025 Wby 6 wickets 7.908.37
Sunrisers Eastern CapeSunrisers Eastern Cape (H)11 Jan 2025 Wby 9 wickets 8.759.43
Joburg Super KingsJoburg Super Kings (H)7 Feb 2024 Lby 9 wickets 10.437.33
Sunrisers Eastern CapeSunrisers Eastern Cape (H)2 Feb 2024 Lby 44 runs 10.408.20
Durban's Super GiantsDurban's Super Giants (H)26 Jan 2024 Lby 57 runs 9.506.82
MI Cape TownMI Cape Town (H)21 Jan 2024 Wby 59 runs 5.628.10
Joburg Super KingsJoburg Super Kings (H)17 Jan 2024 Wby 7 wickets 6.769.53
Pretoria CapitalsPretoria Capitals (H)12 Jan 2024 Wby 27 runs 6.658.00
Pretoria CapitalsPretoria Capitals (H)22 Jan 2023 Wby 6 wickets 7.908.24
MI Cape TownMI Cape Town (H)21 Jan 2023 Lby 13 runs 7.106.45
Sunrisers Eastern CapeSunrisers Eastern Cape (H)19 Jan 2023 Lby 5 wickets 7.156.35
Durban's Super GiantsDurban's Super Giants (H)17 Jan 2023 Wby 10 runs 7.958.45
Joburg Super KingsJoburg Super Kings (H)13 Jan 2023 Wby 7 wickets 4.677.81

Joburg Super Kings Economy Match by Match

Paarl Royals's next opponent, their last 39 SA20 matches

Joburg Super Kings economy →
OpponentResultForAg
Avg 8.528.23
Paarl RoyalsPaarl Royals (A)22 Jan Lby 36 runs 10.508.70
Paarl RoyalsPaarl Royals (A)19 Jan Wby 44 runs 6.728.30
Pretoria CapitalsPretoria Capitals (H)17 Jan Lby 21 runs 7.156.10
Sunrisers Eastern CapeSunrisers Eastern Cape (A)14 Jan Lby 61 runs 8.906.44
MI Cape TownMI Cape Town (H)10 Jan Lby 36 runs 11.709.90
MI Cape TownMI Cape Town (A)6 Jan Lby 4 wickets 11.2910.25
Durban's Super GiantsDurban's Super Giants (H)1 Jan Win a super over 10.2510.25
Durban's Super GiantsDurban's Super Giants (A)30 Dec 2025 Wby 6 wickets 5.017.14
Pretoria CapitalsPretoria Capitals (A)27 Dec 2025 Wby 22 runs 7.308.40
Sunrisers Eastern CapeSunrisers Eastern Cape (A)5 Feb 2025 Lby 32 runs 9.207.60
Durban's Super GiantsDurban's Super Giants (H)1 Feb 2025 Lby 11 runs 8.658.44
Paarl RoyalsPaarl Royals (H)30 Jan 2025 Wby 7 wickets 7.508.47
Pretoria CapitalsPretoria Capitals (A)28 Jan 2025 Lby 6 wickets 8.334.95
Sunrisers Eastern CapeSunrisers Eastern Cape (H)26 Jan 2025 Wby 9 wickets 6.218.50
Sunrisers Eastern CapeSunrisers Eastern Cape (A)24 Jan 2025 Lby 14 runs 8.257.55
Paarl RoyalsPaarl Royals (A)20 Jan 2025 Lby 6 wickets 7.837.30
MI Cape TownMI Cape Town (A)18 Jan 2025 Lby 7 wickets 10.938.60
Durban's Super GiantsDurban's Super Giants (A)14 Jan 2025 Wby 28 runs 7.838.45
MI Cape TownMI Cape Town (H)11 Jan 2025 Wby 6 runs 7.007.13
Durban's Super GiantsDurban's Super Giants (A)8 Feb 2024 Lby 69 runs 10.558.04
Paarl RoyalsPaarl Royals (A)7 Feb 2024 Wby 9 wickets 7.3310.43
Durban's Super GiantsDurban's Super Giants (H)3 Feb 2024 Wby 7 wickets 10.1510.54
Sunrisers Eastern CapeSunrisers Eastern Cape (H)31 Jan 2024 Lby 9 wickets 7.185.09
MI Cape TownMI Cape Town (A)29 Jan 2024 Wby 10 wickets 10.0017.29
Paarl RoyalsPaarl Royals (H)24 Jan 2024 Lby 5 wickets 9.008.40
Pretoria CapitalsPretoria Capitals (H)20 Jan 2024 Wby 6 wickets 8.359.50
Paarl RoyalsPaarl Royals (A)17 Jan 2024 Lby 7 wickets 9.536.76
Durban's Super GiantsDurban's Super Giants (A)15 Jan 2024 Lby 37 runs 7.255.40
MI Cape TownMI Cape Town (H)13 Jan 2024 Lby 98 runs 12.158.13
Sunrisers Eastern CapeSunrisers Eastern Cape (H)9 Feb 2023 Lby 14 runs 10.659.95
MI Cape TownMI Cape Town (H)6 Feb 2023 Wby 76 runs 6.349.45
Sunrisers Eastern CapeSunrisers Eastern Cape (H)5 Feb 2023 Wby 24 runs 6.808.00
Durban's Super GiantsDurban's Super Giants (H)24 Jan 2023 Wby 8 wickets 8.909.50
Sunrisers Eastern CapeSunrisers Eastern Cape (A)21 Jan 2023 Wby 5 wickets 6.806.51
Pretoria CapitalsPretoria Capitals (A)18 Jan 2023 Lby 6 wickets 9.467.79
Pretoria CapitalsPretoria Capitals (H)17 Jan 2023 Wby 6 runs 8.108.40
MI Cape TownMI Cape Town (A)14 Jan 2023 Lby 7 wickets 6.555.25
Paarl RoyalsPaarl Royals (A)13 Jan 2023 Lby 7 wickets 7.814.67
Durban's Super GiantsDurban's Super Giants (A)11 Jan 2023 Wby 16 runs 8.709.50

Paarl Royals Economy Lines

How often they kept under each line, last 24 SA20 matches

LineOverUnderUnder %
718625%
7.5141042%
8111354%
8.5101458%
971771%
LineOverUnderUnder %

Economy Batting First and Chasing

Paarl Royals's economy rate per game by when they batted

BattingPWForAg
First1068.117.92
Second1487.957.60

SA20 2025 Economy Table

Economy rate, this season

SidePForAg
1Sunrisers Eastern CapeSunrisers Eastern Cape 117.448.64
2Paarl RoyalsPaarl Royals 118.117.50
3Pretoria CapitalsPretoria Capitals 118.318.37
4Joburg Super KingsJoburg Super Kings 98.488.14
5Durban's Super GiantsDurban's Super Giants 78.818.91
6MI Cape TownMI Cape Town 99.208.57

Paarl Royals SA20 Economy Questions

What is Paarl Royals's economy rate in SA20 matches?

Paarl Royals's bowlers have conceded 7.97 runs an over over their last 24 SA20 matches, since January 2023, giving away 3,653 runs in 458.2 overs, while Paarl Royals have scored at 7.77 an over against them.

How often do Paarl Royals concede under 8 an over?

Paarl Royals conceded under 8 an over in 13 of their last 24 SA20 matches, since January 2023, 54% of the time, with an economy rate of 7.97 across those games.

Who is Paarl Royals's most economical bowler?

Dunith Wellalage is Paarl Royals's most economical bowler over their last 24 SA20 matches, since January 2023, at 5.89 an over in 5 spells among those bowling three times or more, ahead of Wihan Lubbe (6.08) and Bjorn Fortuin (6.48).