




























Islamabad United Stats
Islamabad United PSL Cricket Performance Points Stats
How many performance points Islamabad United score, and who scores the most, game by game
Updated , after the Hyderabad Kingsmen game
| Player | Avg | Hit % | ||||||||||||||||||||
|---|---|---|---|---|---|---|---|---|---|---|---|---|---|---|---|---|---|---|---|---|---|---|
| Islamabad United total | 359 | 328 | 368 | 312 | 500 | 218 | 474 | 500 | 424 | 414 | 313 | 351 | 329 | 417 | 300 | 267 | 379 | 370 | 236 | 343 | 329 | |
 J. HolderAll-rounder, 4 played |
68.8 | 75%3/4 | 13 | 132 | 50 | 80 | ||||||||||||||||
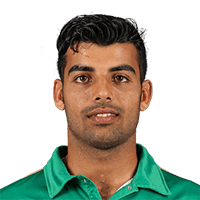 S. KhanAll-rounder, 19 played |
61.8 | 74%14/19 | 22 | 56 | 139 | 142 | 34 | 40 | 70 | 23 | 54 | 44 | 27 | 140 | 66 | 42 | 66 | 75 | 12 | 94 | 28 | |
 S. FarhanKeeper, 5 played |
55.6 | 60%3/5 | 73 | 1 | 63 | 116 | 25 | |||||||||||||||
 M. Wasim JrAll-rounder, 4 played |
44.5 | 100%4/4 | 40 | 34 | 38 | 66 | ||||||||||||||||
 C. MunroBatter, 14 played |
42.4 | 64%9/14 | 58 | 40 | 69 | 84 | 29 | 35 | 15 | 71 | 30 | 14 | 25 | 11 | 50 | 63 | ||||||
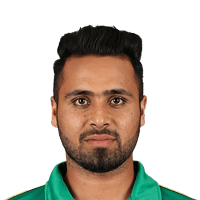 F. AshrafAll-rounder, 15 played |
41.0 | 67%10/15 | 39 | 31 | 0 | 51 | 63 | 72 | 71 | 10 | 1 | 20 | 35 | 58 | 14 | 71 | 79 | |||||
|
S
S. MinhasAll-rounder, 3 played
|
36.7 | 33%1/3 | 6 | 21 | 83 | |||||||||||||||||
 H. AliBowler, 4 played |
34.8 | 50%2/4 | 20 | 70 | 48 | 1 | ||||||||||||||||
 F. FarooqiBowler, 5 played |
34.0 | 60%3/5 | 20 | 30 | 60 | 0 | 60 | |||||||||||||||
 S. IrshadBowler, 3 played |
33.3 | 33%1/3 | 20 | 20 | 60 | |||||||||||||||||
 B. DwarshuisBowler, 3 played |
33.0 | 67%2/3 | 10 | 31 | 58 | |||||||||||||||||
 I. WasimAll-rounder, 15 played |
32.3 | 53%8/15 | 41 | 20 | 20 | 40 | 76 | 40 | 60 | 20 | 64 | 30 | 30 | 24 | 10 | 1 | 9 | |||||
 C. GreenAll-rounder, 3 played |
32.0 | 67%2/3 | 51 | 45 | 0 | |||||||||||||||||
 S. AghaAll-rounder, 11 played |
30.7 | 73%8/11 | 47 | 6 | 30 | 51 | 41 | 2 | 33 | 4 | 47 | 34 | 43 | |||||||||
 N. ShahBowler, 10 played |
28.9 | 30%3/10 | 25 | 21 | 20 | 20 | 47 | 21 | 47 | 20 | 28 | 40 | ||||||||||
 D. ConwayKeeper, 3 played |
28.7 | 67%2/3 | 30 | 38 | 18 | |||||||||||||||||
 A. KhanKeeper, 15 played |
28.5 | 47%7/15 | 16 | 4 | 16 | 45 | 48 | 10 | 19 | 39 | 49 | 85 | 1 | 47 | 0 | 13 | 35 | |||||
 R. RaeesBowler, 5 played |
24.4 | 40%2/5 | 42 | 40 | 20 | 0 | 20 | |||||||||||||||
 A. HalesBatter, 12 played |
23.6 | 17%2/12 | 88 | 23 | 10 | 18 | 0 | 10 | 21 | 57 | 15 | 28 | 1 | 12 | ||||||||
 J. CoxKeeper, 4 played |
21.3 | 25%1/4 | 17 | 36 | 13 | 19 | ||||||||||||||||
 H. AliBatter, 10 played |
20.8 | 30%3/10 | 31 | 13 | 30 | 29 | 16 | 33 | 11 | 19 | 26 | 0 | ||||||||||
|
H
H. ShahBowler, 7 played
|
20.7 | 14%1/7 | 20 | 20 | 20 | 23 | 40 | 0 | 22 | |||||||||||||
 R. GurbazKeeper, 5 played |
18.6 | 40%2/5 | 10 | 33 | 15 | 35 | 0 | |||||||||||||||
 M. ShahzadAll-rounder, 4 played |
18.5 | 25%1/4 | 24 | 30 | 10 | 10 | ||||||||||||||||
 S. MirzaBowler, 3 played |
16.7 | 33%1/3 | 20 | 30 | 0 | |||||||||||||||||
 T. MillsBowler, 4 played |
15.3 | 25%1/4 | 0 | 0 | 60 | 1 | ||||||||||||||||
|
M
M. KhanBatter, 4 played
|
10.8 | 0%0/4 | 10 | 3 | 5 | 25 | ||||||||||||||||
 A. AliBatter, 4 played |
6.5 | 0%0/4 | 5 | 7 | 8 | 6 | ||||||||||||||||
 A. GousKeeper, 4 played |
3.8 | 0%0/4 | 2 | 9 | 0 | 4 | ||||||||||||||||
 M. ChapmanAll-rounder, 2 played |
61.0 | 100%2/2 | 53 | 69 | ||||||||||||||||||
 M. GuptillBatter, 1 played |
56.0 | 100%1/1 | 56 | |||||||||||||||||||
 S. MaqsoodBatter, 2 played |
42.5 | 50%1/2 | 60 | 25 | ||||||||||||||||||
 R. MeredithBowler, 2 played |
40.0 | 100%2/2 | 50 | 30 | ||||||||||||||||||
 M. NawazAll-rounder, 2 played |
25.0 | 50%1/2 | 10 | 40 | ||||||||||||||||||
|
M
M. RiazBatter, 2 played
|
20.0 | 0%0/2 | 15 | 25 | ||||||||||||||||||
 O. McCoyBowler, 1 played |
20.0 | 0%0/1 | 20 | |||||||||||||||||||
|
S
S. MasoodAll-rounder, 1 played
|
20.0 | 0%0/1 | 20 | |||||||||||||||||||
 R. GleesonBowler, 1 played |
20.0 | 0%0/1 | 20 | |||||||||||||||||||
 Q. AkramAll-rounder, 1 played |
10.0 | 0%0/1 | 10 | |||||||||||||||||||
|
G
G. GhoriKeeper, 1 played
|
10.0 | 0%0/1 | 10 | |||||||||||||||||||
 R. van der DussenBatter, 1 played |
1.00 | 0%0/1 | 1 | |||||||||||||||||||
|
H
H. NawazBatter, 1 played
|
0.00 | 0%0/1 | 0 | |||||||||||||||||||
 M. FordeAll-rounder, 1 played |
0.00 | 0%0/1 | 0 | |||||||||||||||||||
 K. MayersAll-rounder, 1 played |
0.00 | 0%0/1 | 0 | |||||||||||||||||||

Islamabad United Team Performance
Islamabad United Performance Match by Match
The last 20 PSL matches and how often Islamabad United went over the line
Islamabad United Performance Lines
How often each line went over, last 20 PSL matches
| Line | Over | Under | Over % |
|---|---|---|---|
| 320.5 | 14 | 6 | 70% |
| 340.5 | 11 | 9 | 55% |
| 360.5 | 9 | 11 | 45% |
| 380.5 | 6 | 14 | 30% |
| 400.5 | 6 | 14 | 30% |
| Line | Over | Under | Over % |
|---|---|---|---|
| 680.5 | 14 | 6 | 70% |
| 700.5 | 13 | 7 | 65% |
| 720.5 | 11 | 9 | 55% |
| 740.5 | 7 | 13 | 35% |
| 760.5 | 6 | 14 | 30% |
Performance Batting First and Chasing
Islamabad United's performance points per game by when they batted
| Batting | P | W | For | Ag |
|---|---|---|---|---|
| First | 6 | 5 | 429 | 311 |
| Second | 14 | 7 | 329 | 372 |
PSL 2026 Performance Table
Performance points per game, this season
| Side | P | For | Ag | Match |
|---|---|---|---|---|
1 Peshawar Zalmi |
11 | 421 | 273 | 695 |
2 Multan Sultans |
11 | 351 | 330 | 681 |
3 Hyderabad Kingsmen |
13 | 335 | 338 | 672 |
| 4Islamabad United |
11 | 320 | 306 | 626 |
5 Karachi Kings |
10 | 314 | 359 | 673 |
6 Lahore Qalandars |
10 | 306 | 338 | 644 |
7 Quetta Gladiators |
10 | 305 | 355 | 660 |
8 Rawalpindiz |
10 | 291 | 361 | 652 |
Islamabad United PSL Performance Questions
How many performance points do Islamabad United score per PSL match?
Islamabad United have averaged 359 performance points per PSL match over their last 20 PSL matches, since March 2023, against their opponents' 354, with 712 in the match between them, and their best was 500 against Karachi Kings on 19 May 2025.
How often do Islamabad United go over 360.5 performance points?
Islamabad United went over 360.5 performance points in 9 of their last 20 PSL matches, since March 2023, 45% of the time, while averaging 359 per PSL match against their opponents' 354, and made 328 in their latest, against Hyderabad Kingsmen.
Who scores the most performance points for Islamabad United?
Shadab Khan scores the most performance points for Islamabad United over their last 20 PSL matches, since March 2023, with 1174 in 19 games at 61.8 a game, ahead of Faheem Ashraf (615) and Colin Munro (594).
What is Islamabad United's highest performance points in a recent PSL match?
Islamabad United's highest over their last 20 PSL matches, since March 2023, is 500 performance points against Karachi Kings on 19 May 2025 at Rawalpindi Cricket Stadium, Rawalpindi, against their average of 359.
Do Islamabad United score more performance points batting first or chasing?
Batting first brings Islamabad United more performance points over their last 20 PSL matches, since March 2023: they average 429 performance points batting first in 6 PSL matches, and 329 batting second in 14, a gap of 100 performance points.