




























Barbados Royals Stats
Barbados Royals CPL Cricket Performance Points Stats
How many performance points Barbados Royals score, and who scores the most, game by game
Updated , after the Jamaica Kingsmen game
| Player | Avg | Hit % | ||||||||||||||||||||
|---|---|---|---|---|---|---|---|---|---|---|---|---|---|---|---|---|---|---|---|---|---|---|
| Barbados Royals total | 301 | 309 | 212 | 224 | 361 | 422 | 270 | 256 | 372 | 230 | 193 | 133 | 336 | 386 | 181 | 343 | 407 | 341 | 430 | 243 | 365 | |
 K. MayersAll-rounder, 4 played |
68.8 | 75%3/4 | 100 | 66 | 20 | 89 | ||||||||||||||||
 Q. de KockKeeper, 17 played |
42.1 | 53%9/17 | 116 | 11 | 16 | 48 | 42 | 42 | 27 | 25 | 67 | 15 | 4 | 38 | 55 | 27 | 29 | 122 | 32 | |||
 M. TheekshanaBowler, 7 played |
41.7 | 71%5/7 | 25 | 20 | 60 | 62 | 34 | 51 | 40 | |||||||||||||
 J. HolderAll-rounder, 11 played |
38.8 | 73%8/11 | 19 | 0 | 24 | 37 | 51 | 37 | 40 | 59 | 48 | 62 | 50 | |||||||||
 D. MillerBatter, 6 played |
38.0 | 67%4/6 | 36 | 60 | 30 | 71 | 21 | 10 | ||||||||||||||
 S. RutherfordBatter, 9 played |
34.0 | 56%5/9 | 36 | 12 | 0 | 71 | 50 | 67 | 55 | 8 | 7 | |||||||||||
 M. Ur RahmanBowler, 9 played |
33.8 | 56%5/9 | 20 | 23 | 55 | 40 | 0 | 21 | 40 | 45 | 60 | |||||||||||
 D. SamsAll-rounder, 9 played |
30.1 | 33%3/9 | 40 | 0 | 29 | 21 | 80 | 21 | 2 | 56 | 22 | |||||||||||
 R. CornwallAll-rounder, 9 played |
29.2 | 44%4/9 | 19 | 0 | 2 | 0 | 34 | 34 | 131 | 2 | 41 | |||||||||||
|
Z
Z. CarterBatter, 5 played
|
28.2 | 40%2/5 | 57 | 28 | 17 | 2 | 37 | |||||||||||||||
 B. KingBatter, 6 played |
28.0 | 33%2/6 | 2 | 39 | 73 | 29 | 22 | 3 | ||||||||||||||
 K. MaharajBowler, 3 played |
27.7 | 67%2/3 | 22 | 31 | 30 | |||||||||||||||||
|
R
R. ClarkeKeeper, 7 played
|
26.7 | 43%3/7 | 0 | 45 | 27 | 23 | 30 | 17 | 45 | |||||||||||||
 O. McCoyBowler, 10 played |
25.4 | 50%5/10 | 0 | 0 | 43 | 1 | 50 | 60 | 0 | 0 | 50 | 50 | ||||||||||
 C. GreenAll-rounder, 7 played |
25.0 | 29%2/7 | 28 | 47 | 9 | 17 | 60 | 10 | 4 | |||||||||||||
 G. MotieBowler, 5 played |
23.8 | 20%1/5 | 0 | 7 | 22 | 70 | 20 | |||||||||||||||
 R. PowellBatter, 12 played |
23.5 | 33%4/12 | 1 | 31 | 41 | 71 | 12 | 9 | 18 | 60 | 1 | 19 | 10 | 9 | ||||||||
|
R
R. SimmondsKeeper, 15 played
|
22.0 | 27%4/15 | 0 | 20 | 20 | 30 | 30 | 23 | 20 | 70 | 0 | 20 | 20 | 4 | 60 | 13 | 0 | |||||
 J. WarricanBowler, 3 played |
21.3 | 0%0/3 | 20 | 24 | 20 | |||||||||||||||||
 N. ul HaqBowler, 6 played |
20.3 | 33%2/6 | 10 | 20 | 61 | 1 | 0 | 30 | ||||||||||||||
|
K
K. AlleyneAll-rounder, 9 played
|
19.4 | 33%3/9 | 11 | 51 | 42 | 13 | 11 | 12 | 1 | 4 | 30 | |||||||||||
 A. AthanazeBatter, 5 played |
19.0 | 20%1/5 | 26 | 44 | 8 | 10 | 7 | |||||||||||||||
|
S
S. ParrisBowler, 4 played
|
17.0 | 0%0/4 | 25 | 17 | 20 | 6 | ||||||||||||||||
|
K
K. AndersonBatter, 3 played
|
12.7 | 0%0/3 | 10 | 6 | 22 | |||||||||||||||||
 E. BoschBowler, 3 played |
9.3 | 0%0/3 | 0 | 28 | 0 | |||||||||||||||||
 N. YoungBowler, 5 played |
6.0 | 0%0/5 | 0 | 0 | 17 | 10 | 3 | |||||||||||||||
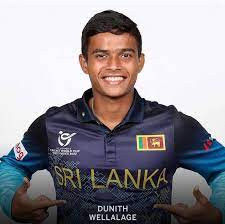 D. WellalageBowler, 2 played |
64.5 | 100%2/2 | 99 | 30 | ||||||||||||||||||
|
K
K. JamesAll-rounder, 2 played
|
41.0 | 100%2/2 | 46 | 36 | ||||||||||||||||||
 A. KhanKeeper, 2 played |
36.0 | 50%1/2 | 52 | 20 | ||||||||||||||||||
 Q. AhmadBowler, 1 played |
34.0 | 100%1/1 | 34 | |||||||||||||||||||
 C. BoschAll-rounder, 1 played |
33.0 | 100%1/1 | 33 | |||||||||||||||||||
 R. van der MerweAll-rounder, 1 played |
30.0 | 100%1/1 | 30 | |||||||||||||||||||
|
K
K. WickhamAll-rounder, 1 played
|
23.0 | 0%0/1 | 23 | |||||||||||||||||||
 S. BrooksBatter, 2 played |
21.0 | 50%1/2 | 11 | 31 | ||||||||||||||||||
 H. WalshBowler, 1 played |
20.0 | 0%0/1 | 20 | |||||||||||||||||||
 L. EvansBatter, 1 played |
20.0 | 0%0/1 | 20 | |||||||||||||||||||
|
Z
Z. MotaraAll-rounder, 1 played
|
20.0 | 0%0/1 | 20 | |||||||||||||||||||
|
S
S. BrathwaiteAll-rounder, 2 played
|
10.0 | 0%0/2 | 13 | 7 | ||||||||||||||||||
 D. ThomasKeeper, 2 played |
8.5 | 0%0/2 | 1 | 16 | ||||||||||||||||||
 H. TectorBatter, 2 played |
7.5 | 0%0/2 | 10 | 5 | ||||||||||||||||||
 N. ZadranBatter, 2 played |
6.0 | 0%0/2 | 2 | 10 | ||||||||||||||||||
 R. van der DussenBatter, 1 played |
4.0 | 0%0/1 | 4 | |||||||||||||||||||
 J. BishopAll-rounder, 1 played |
0.00 | 0%0/1 | 0 | |||||||||||||||||||

Barbados Royals Team Performance
Barbados Royals Performance Match by Match
The last 20 CPL matches and how often Barbados Royals went over the line
Barbados Royals Performance Lines
How often each line went over, last 20 CPL matches
| Line | Over | Under | Over % |
|---|---|---|---|
| 260.5 | 12 | 8 | 60% |
| 280.5 | 11 | 9 | 55% |
| 300.5 | 11 | 9 | 55% |
| 320.5 | 10 | 10 | 50% |
| 340.5 | 9 | 11 | 45% |
| Line | Over | Under | Over % |
|---|---|---|---|
| 600.5 | 13 | 7 | 65% |
| 620.5 | 11 | 9 | 55% |
| 640.5 | 10 | 10 | 50% |
| 660.5 | 8 | 12 | 40% |
| 680.5 | 6 | 14 | 30% |
Performance Batting First and Chasing
Barbados Royals's performance points per game by when they batted
| Batting | P | W | For | Ag |
|---|---|---|---|---|
| First | 10 | 3 | 284 | 327 |
| Second | 10 | 4 | 318 | 339 |
CPL 2026 Performance Table
Performance points per game, this season
| Side | P | For | Ag | Match |
|---|---|---|---|---|
1 Antigua & Barbuda Falcons |
11 | 348 | 281 | 629 |
2 St Kitts and Nevis Patriots |
9 | 313 | 328 | 641 |
| 3Barbados Royals |
11 | 310 | 311 | 621 |
4 Guyana Amazon Warriors |
12 | 306 | 274 | 580 |
5 Saint Lucia Kings |
10 | 300 | 342 | 642 |
6 Trinbago Knight Riders |
10 | 298 | 297 | 595 |
7 Jamaica Kingsmen |
13 | 292 | 336 | 628 |
Barbados Royals CPL Performance Questions
How many performance points do Barbados Royals score per CPL match?
Barbados Royals have averaged 301 performance points per CPL match over their last 20 CPL matches, since September 2022, against their opponents' 333, with 634 in the match between them, and their best was 430 against Guyana Amazon Warriors on 27 Sep 2022.
How often do Barbados Royals go over 300.5 performance points?
Barbados Royals went over 300.5 performance points in 11 of their last 20 CPL matches, since September 2022, 55% of the time, while averaging 301 per CPL match against their opponents' 333, and made 309 in their latest, against St Kitts and Nevis Patriots.
Who scores the most performance points for Barbados Royals?
Quinton de Kock scores the most performance points for Barbados Royals over their last 20 CPL matches, since September 2022, with 716 in 17 games at 42.1 a game, ahead of Jason Holder (427) and Ramon Simmonds (330).
What is Barbados Royals's highest performance points in a recent CPL match?
Barbados Royals's highest over their last 20 CPL matches, since September 2022, is 430 performance points against Guyana Amazon Warriors on 27 Sep 2022 at Providence Stadium, Providence, against their average of 301.
Do Barbados Royals score more performance points batting first or chasing?
Chasing brings Barbados Royals more performance points over their last 20 CPL matches, since September 2022: they average 284 performance points batting first in 10 CPL matches, and 318 batting second in 10, a gap of 34.0 performance points.