






























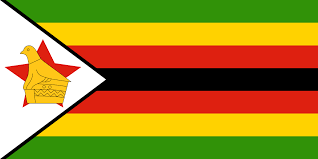
Namibia vs Ireland dream11 pts
Each player's last five against the line, his hit rate over the last ten, his average and our projection.
 NamibiaLast 7 ODI matches
| Player | Last 5 | L10 | Avg | Proj |
|---|---|---|---|---|
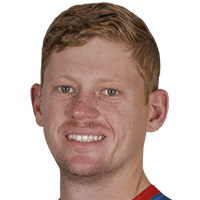 Bernard ScholtzBowler
8588767 |
8588767 | 75%3/4 | 55 | |
 Gerhard ErasmusBatter
104034515652 |
104034515652 | 71%5/7 | 118.6 | |
 Ruben TrumpelmannBowler
321511992140 |
321511992140 | 71%5/7 | 106 | |
 Jack BrassellBatter
13651558167 |
13651558167 | 71%5/7 | 78.1 | |
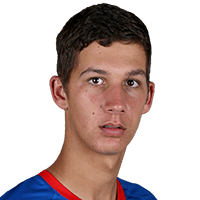 JJ SmitAll-rounder
1141092433154 |
1141092433154 | 60%3/5 | 86.8 | |
|
A
Alexander Busing-VolschenkAll-rounder
2153627412
|
2153627412 | 60%3/5 | 44.4 | |
 Jan Nicol Loftie-EatonAll-rounder
13145632241 |
13145632241 | 50%3/6 | 57.5 | |
 Max HeingoBowler
64850 |
64850 | 33%1/3 | 34.7 | |
 Jan FrylinckAll-rounder
62112821212 |
62112821212 | 29%2/7 | 57 | |
 Louren SteenkampBatter
395614557 |
395614557 | 29%2/7 | 37.6 | |
 Zane GreenKeeper
5720351065 |
5720351065 | 29%2/7 | 32.1 | |
 Malan KrugerKeeper
4616801 |
4616801 | 20%1/5 | 26.8 | |
 Michael Van LingenBatter
164942 |
164942 | 0%0/4 | 24.5 | |
|
W
Waldo SmithAll-rounder
304512
|
304512 | 0%0/3 | 29 | |
 Jan BaltBatter
116 |
116 | 100%1/1 | 116 |
 IrelandLast 10 ODI matches
| Player | Last 5 | L10 | Avg | Proj |
|---|---|---|---|---|
 Mark AdairBowler
97110114 |
97110114 | 100%3/3 | 107 | |
 Curtis CampherAll-rounder
17279104259174 |
17279104259174 | 88%7/8 | 133 | |
 George DockrellBowler
5982924595 |
5982924595 | 86%6/7 | 81.6 | |
|
G
Gavin HoeyAll-rounder
752810816271
|
752810816271 | 71%5/7 | 92.9 | |
|
J
Jai MoondraBowler
43908747235
|
43908747235 | 71%5/7 | 92.9 | |
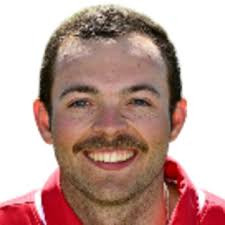 Liam McCarthyBowler
57109601960 |
57109601960 | 71%5/7 | 55.1 | |
 Lorcan TuckerKeeper
237298076 |
237298076 | 60%6/10 | 46.4 | |
 Paul StirlingAll-rounder
77401061731 |
77401061731 | 56%5/9 | 69.4 | |
|
B
Byron McDonoughBowler
165410240
|
165410240 | 50%2/4 | 53 | |
 Cade CarmichaelBatter
466920115 |
466920115 | 40%4/10 | 46.4 | |
 Harry TectorBatter
8152141415 |
8152141415 | 40%4/10 | 42.8 | |
 Andy McBrineBowler
12942723134 |
12942723134 | 40%2/5 | 58 | |
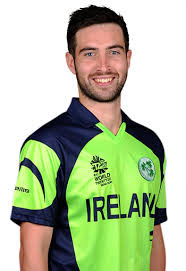 Andrew BalbirnieBatter
2536343249 |
2536343249 | 30%3/10 | 66.9 | |
|
J
Jordan NeillBowler
648877
|
648877 | 25%1/4 | 34.8 | |
 Benjamin CalitzBatter
573018 |
573018 | 25%1/4 | 24 | |
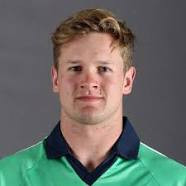 Barry McCarthyBowler
148108 |
148108 | 100%2/2 | 128 | |
 Tim TectorBatter
131 |
131 | 100%1/1 | 131 | |
|
T
Thomas MayesBowler
818
|
818 | 50%1/2 | 44.5 | |
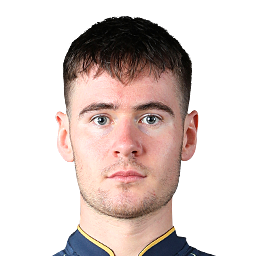 Joshua LittleBowler
589 |
589 | 50%1/2 | 33.5 | |
 Matthew HumphreysBowler
44 |
44 | 0%0/1 | 44 |
Namibia vs Ireland Questions
When is Namibia vs Ireland?
Namibia vs Ireland starts at 07:30 UK time (13:00 in India) on Sunday 1 November 2026, at High Performance Oval, Windhoek, part of ODI 2026; this page has the form, the head to head, the ground and the projections for the match.
What is the Namibia vs Ireland head to head?
Namibia lead the Namibia vs Ireland head to head at 3-2 from 5 ODI meetings, and the latest, on 1 November 2026 at High Performance Oval, was won by Namibia.
What is Namibia's recent form?
Namibia have won 3 and lost 2 of their last 5 ODI matches, newest first W L W W L; most recently they beat Ireland on 01 Nov, 131/5 to 129.
What is Ireland's recent form?
Ireland have won 2 and lost 3 of their last 5 ODI matches, newest first L W L L W; most recently they lost to Namibia on 01 Nov, 129 to 131/5.
What is a good score at High Performance Oval?
A good first-innings score at High Performance Oval is around 249, the average over its last 4 ODI matches, and the side batting first has won 75% of them, so batting first has had the edge there.