



























T20 Internationals 2021
InternationalT20 Internationals Player Economy Rate 2021
Every player ranked on economy rates. Sorted on at least 10 overs.
Updated 24 December 2021, after United States of America vs Ireland
| #Player | M | Overs | Wkts | Econ | Avg | SR | Dots | Dot % | Mdns | Best |
|---|---|---|---|---|---|---|---|---|---|---|
1
  Ajaz Patel Bowler |
5 | 20.3 | 10 | 3.56 | 7.30 | 12.3 | 79 | 64.2% | 0 | 4 |
2
  Keshav Maharaj Bowler |
3 | 10.4 | 3 | 4.03 | 14.33 | 21.3 | 29 | 45.3% | 1 | 1 |
3
 Rachin Ravindra All-rounder |
6 | 19.1 | 6 | 4.33 | 13.83 | 19.2 | 59 | 51.3% | 0 | 3 |
4
 Tabraiz Shamsi Bowler |
13 | 52.3 | 24 | 4.78 | 10.46 | 13.1 | 139 | 44.1% | 0 | 4 |
5
B  Burhan Niaz All-rounder |
4 | 12.4 | 8 | 4.89 | 7.75 | 9.5 | 40 | 52.6% | 1 | 4 |
6
  Wanindu Hasaranga All-rounder |
6 | 23.1 | 10 | 5.01 | 11.60 | 13.9 | 71 | 51.1% | 0 | 3 |
|
7
S
Saber Zakhil All-rounder
|
4 | 12.1 | 6 | 5.10 | 10.33 | 12.2 | 34 | 46.6% | 0 | 3 |
8
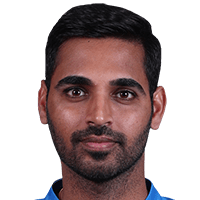  Bhuvneshwar Kumar Bowler |
3 | 10.1 | 5 | 5.11 | 10.40 | 12.2 | 29 | 47.5% | 0 | 4 |
|
9
K
Khalid Ahmadi Batter
|
5 | 18.3 | 6 | 5.19 | 16.00 | 18.5 | 51 | 45.9% | 0 | 2 |
10
 Varun Chakaravarthy Bowler |
3 | 11.4 | 2 | 5.23 | 30.50 | 35.0 | 29 | 41.4% | 0 | 1 |
11
  Joshua Little Bowler |
3 | 11.4 | 1 | 5.31 | 62.00 | 70.0 | 34 | 48.6% | 0 | 1 |
12
  Mohammad Wasim Jr All-rounder |
4 | 14.3 | 6 | 5.52 | 13.33 | 14.5 | 41 | 47.1% | 0 | 2 |
13
 Lakshan Sandakan Bowler |
3 | 11.5 | 6 | 5.66 | 11.17 | 11.8 | 32 | 45.1% | 0 | 3 |
14
 Bjorn Fortuin Bowler |
8 | 28.4 | 10 | 5.72 | 16.40 | 17.2 | 79 | 45.9% | 0 | 3 |
15
 Ashiqullah Said Bowler |
5 | 18 | 6 | 5.89 | 17.67 | 18.0 | 56 | 51.9% | 0 | 3 |
16
A  Abhijit Venkatesh Batter |
4 | 14.4 | 7 | 5.93 | 12.43 | 12.6 | 37 | 42.0% | 0 | 3 |
|
17
N
Nemish Mehta Bowler
|
5 | 19.5 | 6 | 6.05 | 20.00 | 19.8 | 55 | 46.2% | 0 | 2 |
18
 Dushmantha Chameera Bowler |
6 | 24.1 | 10 | 6.12 | 14.80 | 14.5 | 67 | 46.2% | 0 | 4 |
19
D  Dinesh Nakrani Bowler |
3 | 10.1 | 2 | 6.30 | 32.00 | 30.5 | 21 | 34.4% | 0 | 1 |
20
 Cole McConchie All-rounder |
5 | 18.3 | 7 | 6.32 | 16.71 | 15.9 | 55 | 49.5% | 0 | 3 |
21
  Josh Hazlewood Bowler |
8 | 31.5 | 12 | 6.35 | 16.83 | 15.9 | 88 | 46.1% | 1 | 3 |
22
 Ashton Agar Bowler |
12 | 44.5 | 12 | 6.36 | 23.75 | 22.4 | 115 | 42.8% | 0 | 6 |
23
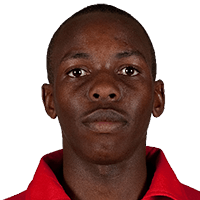  Wellington Masakadza Bowler |
9 | 29.4 | 9 | 6.37 | 21.00 | 19.8 | 69 | 38.8% | 0 | 2 |
24
 Mitchell Santner All-rounder |
3 | 12.2 | 4 | 6.41 | 19.75 | 18.5 | 27 | 36.5% | 0 | 3 |
25
 Anrich Nortje Bowler |
6 | 20.4 | 6 | 6.53 | 22.50 | 20.7 | 53 | 42.7% | 0 | 2 |
26
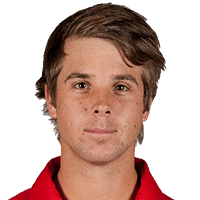 Ryan Burl Batter |
9 | 23.2 | 8 | 6.73 | 19.63 | 17.5 | 46 | 32.9% | 0 | 3 |
27
 Mitchell Marsh All-rounder |
15 | 16.1 | 8 | 6.74 | 13.63 | 12.1 | 41 | 42.3% | 0 | 3 |
28
 Daniel Christian All-rounder |
7 | 11.5 | 2 | 6.85 | 40.50 | 35.5 | 29 | 40.8% | 0 | 2 |
29
 Andrew Tye Bowler |
4 | 15.1 | 8 | 6.86 | 13.00 | 11.4 | 36 | 39.6% | 0 | 3 |
30
 Richard Ngarava Bowler |
11 | 43.2 | 12 | 6.88 | 24.83 | 21.7 | 129 | 49.6% | 3 | 2 |
31
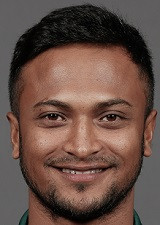  Shakib Al Hasan All-rounder |
3 | 12.1 | 3 | 6.90 | 28.00 | 24.3 | 22 | 30.1% | 0 | 1 |
32
 George Linde All-rounder |
7 | 24.3 | 10 | 7.02 | 17.20 | 14.7 | 60 | 40.8% | 0 | 2 |
33
 Luke Jongwe All-rounder |
8 | 31.1 | 12 | 7.06 | 18.33 | 15.6 | 67 | 35.8% | 0 | 3 |
34
 Khalid Zahid All-rounder |
4 | 16 | 1 | 7.06 | 113.00 | 96.0 | 34 | 35.4% | 0 | 1 |
35
 Simi Singh Batter |
5 | 19.2 | 2 | 7.14 | 69.00 | 58.0 | 38 | 32.8% | 0 | 1 |
36
 Dwaine Pretorius All-rounder |
5 | 14.2 | 7 | 7.19 | 14.71 | 12.3 | 28 | 32.6% | 0 | 5 |
37
 Sean Williams Batter |
6 | 10 | 1 | 7.20 | 72.00 | 60.0 | 21 | 35.0% | 0 | 1 |
|
38
L
Liam Karlsson Bowler
|
4 | 12.4 | 5 | 7.26 | 18.40 | 15.2 | 33 | 43.4% | 0 | 3 |
39
 Benjamin White Bowler |
4 | 15.5 | 4 | 7.33 | 29.00 | 23.8 | 36 | 37.9% | 0 | 2 |
40
  Jofra Archer Bowler |
5 | 20.5 | 7 | 7.44 | 22.14 | 17.9 | 54 | 43.2% | 1 | 4 |
41
 Aiden Markram Batter |
9 | 11.3 | 5 | 7.48 | 17.20 | 13.8 | 32 | 46.4% | 1 | 3 |
42
 Mohammad Nawaz All-rounder |
8 | 26.1 | 7 | 7.53 | 28.14 | 22.4 | 61 | 38.9% | 0 | 2 |
43
 Wiaan Mulder All-rounder |
4 | 10 | 5 | 7.60 | 15.20 | 12.0 | 14 | 23.3% | 0 | 2 |
44
 Trent Boult Bowler |
3 | 12.5 | 3 | 7.64 | 32.67 | 25.7 | 36 | 46.8% | 0 | 2 |
45
 Tendai Chatara Bowler |
6 | 22.4 | 6 | 7.68 | 29.00 | 22.7 | 54 | 39.7% | 0 | 2 |
46
 Adam Zampa Bowler |
14 | 50.4 | 13 | 7.70 | 30.00 | 23.4 | 119 | 39.1% | 0 | 2 |
47
 Mohammad Hasnain Bowler |
6 | 22.4 | 10 | 7.76 | 17.60 | 13.6 | 58 | 42.6% | 0 | 3 |
48
 Adil Rashid Bowler |
5 | 19 | 4 | 7.79 | 37.00 | 28.5 | 43 | 37.7% | 1 | 1 |
49
 Sam Curran All-rounder |
5 | 10 | 2 | 7.80 | 39.00 | 30.0 | 17 | 28.3% | 1 | 1 |
50
 Curtis Campher All-rounder |
5 | 18.2 | 7 | 7.80 | 20.43 | 15.7 | 42 | 38.2% | 2 | 4 |
51
 Mark Wood Bowler |
4 | 16.2 | 5 | 7.90 | 25.80 | 19.6 | 43 | 43.9% | 1 | 3 |
52
 Shoriful Islam Bowler |
6 | 20.3 | 8 | 8.00 | 20.50 | 15.4 | 47 | 38.2% | 0 | 3 |
53
 Haris Rauf Bowler |
11 | 41.3 | 12 | 8.14 | 28.17 | 20.8 | 77 | 30.9% | 0 | 2 |
54
 Mitchell Starc Bowler |
6 | 24.2 | 4 | 8.30 | 50.50 | 36.5 | 69 | 47.3% | 0 | 2 |
55
 Mark Adair Bowler |
4 | 16.5 | 4 | 8.32 | 35.00 | 25.3 | 33 | 32.7% | 0 | 2 |
56
 Jhye Richardson Bowler |
5 | 16.3 | 4 | 8.42 | 34.75 | 24.8 | 35 | 35.4% | 0 | 2 |
|
57
R
Riazat Ali Shah All-rounder
|
3 | 10.1 | 3 | 8.46 | 28.67 | 20.3 | 26 | 42.6% | 0 | 3 |
58
 Lungi Ngidi Bowler |
7 | 27.1 | 8 | 8.47 | 28.75 | 20.4 | 66 | 40.5% | 0 | 3 |
59
 Ben Stokes All-rounder |
5 | 12.3 | 3 | 8.48 | 35.33 | 25.0 | 21 | 28.0% | 0 | 1 |
60
 Isuru Udana All-rounder |
3 | 12.5 | 3 | 8.57 | 36.67 | 25.7 | 23 | 29.9% | 0 | 1 |
61
 Blessing Muzarabani Bowler |
6 | 24.5 | 6 | 8.58 | 35.50 | 24.8 | 53 | 35.6% | 0 | 2 |
62
 Shaheen Afridi Bowler |
9 | 30.5 | 10 | 8.63 | 26.60 | 18.5 | 79 | 42.7% | 0 | 3 |
63
 Usman Qadir Bowler |
8 | 25.1 | 9 | 8.70 | 24.33 | 16.8 | 54 | 35.8% | 0 | 3 |
64
 Kagiso Rabada Bowler |
9 | 31 | 10 | 8.74 | 27.10 | 18.6 | 71 | 38.2% | 0 | 3 |
65
 Kane Richardson Bowler |
5 | 15.3 | 7 | 8.84 | 19.57 | 13.3 | 28 | 30.1% | 0 | 3 |
66
 Imad Wasim All-rounder |
3 | 12.1 | 4 | 8.88 | 27.00 | 18.3 | 30 | 41.1% | 0 | 2 |
67
 Nasum Ahmed Bowler |
4 | 13.1 | 2 | 9.19 | 60.50 | 39.5 | 23 | 29.1% | 0 | 2 |
68
 Mohammad Saifuddin All-rounder |
5 | 19.5 | 4 | 9.43 | 46.75 | 29.8 | 34 | 28.6% | 0 | 2 |
69
 Riley Meredith Bowler |
5 | 19.5 | 8 | 9.48 | 23.50 | 14.9 | 48 | 40.3% | 0 | 3 |
70
 Andile Phehlukwayo All-rounder |
4 | 12.1 | 4 | 9.53 | 29.00 | 18.3 | 26 | 35.6% | 0 | 2 |
71
  Dominic Drakes Bowler |
3 | 11.4 | 2 | 9.77 | 57.00 | 35.0 | 12 | 17.1% | 0 | 1 |
72
 Donald Tiripano Bowler |
4 | 14.5 | 4 | 9.78 | 36.25 | 22.3 | 21 | 23.6% | 0 | 3 |
73
 Akila Dananjaya All-rounder |
7 | 22.4 | 4 | 10.19 | 57.75 | 34.0 | 50 | 36.8% | 0 | 3 |
74
 Chris Jordan Bowler |
5 | 19.2 | 4 | 10.24 | 49.50 | 29.0 | 31 | 26.7% | 1 | 2 |
75
 Romario Shepherd All-rounder |
3 | 11.4 | 4 | 10.71 | 31.25 | 17.5 | 15 | 21.4% | 0 | 2 |
76
 Taskin Ahmed Bowler |
4 | 12 | 2 | 10.75 | 64.50 | 36.0 | 24 | 33.3% | 0 | 1 |
77
 Odean Smith All-rounder |
3 | 10.3 | 4 | 10.86 | 28.50 | 15.8 | 11 | 17.5% | 0 | 2 |
78
 Mahedi Hasan All-rounder |
5 | 12.3 | 5 | 11.60 | 29.00 | 15.0 | 18 | 24.0% | 0 | 2 |
T20 Internationals Stats Questions
T20 Internationals 2021 player and team stats: runs, averages and strike rates, wickets and economy, fielding and Dream11 points, and every side's batting, bowling and fielding. Statz tracks T20 Internationals 2021 across the points table, season leaderboards and venue scoring trends, updated after every completed match.
T20 Internationals on Statz
Frequently asked questions
Who scored the most runs in the T20 Internationals 2021?
Mohammad Rizwan (Pakistan) with 1045 runs in 20 matches, at a strike rate of 137.0.
Who took the most wickets in the T20 Internationals 2021?
Tabraiz Shamsi (South Africa) with 28 wickets at 5.34 an over.
Who hit the most sixes in the T20 Internationals 2021?
Martin Guptill with 33 sixes.