



























T20 Internationals 2020
InternationalT20 Internationals Player Dot Ball Percentage 2020
Every player ranked on dot ball percentages. Sorted on at least 10 overs.
Updated 1 December 2020, after South Africa vs England
| #Player | M | Overs | Wkts | Econ | Avg | SR | Dots | Dot % | Mdns | Best |
|---|---|---|---|---|---|---|---|---|---|---|
1
  Usman Qadir Bowler |
3 | 11.1 | 2.7 | 5.37 | 7.50 | 8.4 | 12.0 | 53.7% | 0.0 | 4 |
2
  Scott Kuggeleijn All-rounder |
3 | 10.5 | 1.0 | 6.83 | 24.67 | 21.7 | 10.3 | 47.7% | 0.0 | 2 |
3
  George Linde All-rounder |
3 | 12.1 | 0.67 | 6.00 | 36.50 | 36.5 | 11.3 | 46.6% | 0.0 | 2 |
4
S  Syazrul Idrus Bowler |
4 | 14.3 | 2.0 | 5.45 | 9.88 | 10.9 | 10.0 | 46.0% | 0.0 | 3 |
5
  Mark Wood Bowler |
3 | 12.4 | 1.0 | 7.42 | 31.33 | 25.3 | 11.3 | 44.7% | 0.0 | 1 |
6
  Vasu Saini All-rounder |
4 | 12.3 | 0.75 | 6.00 | 25.00 | 25.0 | 8.3 | 44.0% | 0.0 | 2 |
7
  Sheldon Cottrell Bowler |
3 | 12.2 | 1.3 | 6.49 | 20.00 | 18.5 | 10.7 | 43.2% | 0.0 | 2 |
8
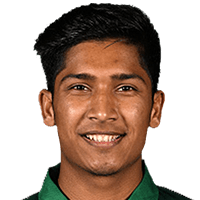 Mohammad Hasnain Bowler |
5 | 20.3 | 0.80 | 6.39 | 32.75 | 30.8 | 9.6 | 39.0% | 0.0 | 2 |
9
  Mujeeb Ur Rahman Bowler |
3 | 12 | 1.7 | 9.92 | 23.80 | 14.4 | 9.0 | 37.5% | 0.0 | 3 |
10
 Jofra Archer Bowler |
3 | 11.5 | 1.0 | 8.11 | 32.00 | 23.7 | 8.7 | 36.6% | 0.0 | 2 |
11
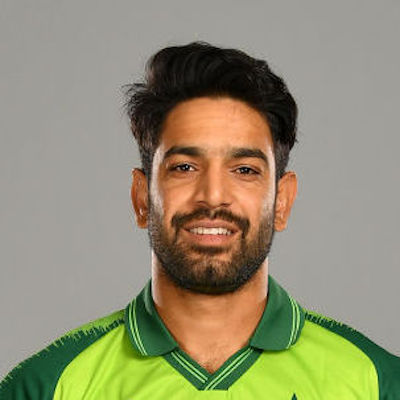 Haris Rauf Bowler |
5 | 20.4 | 1.6 | 7.40 | 19.13 | 15.5 | 9.0 | 36.3% | 0.0 | 3 |
12
 Anrich Nortje Bowler |
4 | 16.1 | 0.75 | 7.92 | 42.67 | 32.3 | 8.8 | 36.1% | 0.0 | 1 |
13
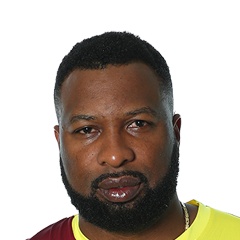 Kieron Pollard All-rounder |
3 | 10.2 | 2.3 | 6.19 | 9.14 | 8.9 | 7.3 | 35.5% | 0.0 | 4 |
14
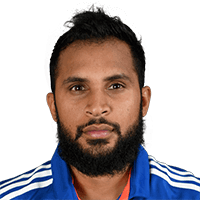 Adil Rashid Bowler |
5 | 19.3 | 1.6 | 7.54 | 18.38 | 14.6 | 8.2 | 35.0% | 0.0 | 3 |
15
 Dwayne Bravo All-rounder |
3 | 10.3 | 1.7 | 6.19 | 13.00 | 12.6 | 7.3 | 34.9% | 0.0 | 3 |
16
 Rashid Khan Bowler |
3 | 13 | 1.7 | 5.54 | 14.40 | 15.6 | 9.0 | 34.6% | 0.0 | 3 |
17
 Pavandeep Singh Bowler |
5 | 18.1 | 1.2 | 5.94 | 18.00 | 18.2 | 7.0 | 32.1% | 0.0 | 3 |
18
 Tim Southee Bowler |
7 | 29 | 0.86 | 8.90 | 43.00 | 29.0 | 7.9 | 31.6% | 0.0 | 2 |
19
 Ish Sodhi Bowler |
6 | 25.4 | 1.2 | 6.70 | 24.57 | 22.0 | 7.8 | 30.5% | 0.0 | 3 |
20
 Mitchell Santner All-rounder |
7 | 25.4 | 0.71 | 9.04 | 46.40 | 30.8 | 6.6 | 29.9% | 0.0 | 2 |
21
 Kagiso Rabada Bowler |
5 | 19.4 | 0.60 | 8.69 | 57.00 | 39.3 | 6.8 | 28.8% | 0.0 | 1 |
22
 Lungi Ngidi Bowler |
6 | 23.1 | 1.5 | 9.32 | 24.00 | 15.4 | 6.7 | 28.8% | 0.0 | 3 |
23
 Khizar Hayat Bowler |
5 | 17 | 1.6 | 7.12 | 15.13 | 12.8 | 5.8 | 28.4% | 0.0 | 5 |
|
24
F
Fitri Sham Bowler
|
4 | 14.1 | 1.5 | 6.85 | 16.17 | 14.2 | 6.0 | 28.2% | 0.0 | 3 |
25
 Chris Jordan Bowler |
5 | 17.5 | 1.0 | 8.52 | 30.40 | 21.4 | 6.0 | 28.0% | 0.0 | 2 |
26
 Tabraiz Shamsi Bowler |
6 | 24.1 | 1.2 | 7.28 | 25.14 | 20.7 | 6.7 | 27.6% | 0.0 | 3 |
27
 Tom Curran All-rounder |
5 | 19.3 | 0.60 | 8.15 | 53.00 | 39.0 | 6.4 | 27.4% | 0.0 | 1 |
28
 Hamish Bennett Bowler |
6 | 22.4 | 1.0 | 10.19 | 38.50 | 22.7 | 6.2 | 27.2% | 0.0 | 3 |
29
 Sharvin Muniandy Bowler |
5 | 17.3 | 1.0 | 9.14 | 32.00 | 21.0 | 4.4 | 21.0% | 0.0 | 2 |
T20 Internationals Stats Questions
T20 Internationals 2020 player and team stats: runs, averages and strike rates, wickets and economy, fielding and Dream11 points, and every side's batting, bowling and fielding. Statz tracks T20 Internationals 2020 across the points table, season leaderboards and venue scoring trends, updated after every completed match.
T20 Internationals on Statz
Frequently asked questions
Who scored the most runs in the T20 Internationals 2020?
Dawid Malan (England) with 363 runs in 8 matches, at a strike rate of 148.8.
Who took the most wickets in the T20 Internationals 2020?
Ashton Agar (Australia) with 13 wickets at 6.75 an over.
Who hit the most sixes in the T20 Internationals 2020?
Kieron Pollard with 17 sixes.