



























T20 Internationals 2020
InternationalT20 Internationals Player Dot Ball Percentage 2020
Every player ranked on dot ball percentages. Sorted on at least 10 overs.
Updated 1 December 2020, after South Africa vs England
| #Player | M | Overs | Wkts | Econ | Avg | SR | Dots | Dot % | Mdns | Best |
|---|---|---|---|---|---|---|---|---|---|---|
1
  Blessing Muzarabani Bowler |
3 | 10.3 | 1.3 | 6.86 | 18.00 | 15.8 | 9.7 | 46.0% | 0.0 | 2 |
2
  Oshane Thomas Bowler |
4 | 15.5 | 2.3 | 7.52 | 13.22 | 10.6 | 10.3 | 43.2% | 0.0 | 5 |
3
  Kinchit Shah Batter |
5 | 17 | 0.40 | 6.24 | 53.00 | 51.0 | 8.8 | 43.1% | 0.0 | 1 |
4
 Sheldon Cottrell Bowler |
4 | 15.3 | 0.75 | 7.23 | 37.33 | 31.0 | 9.8 | 41.9% | 0.0 | 1 |
5
  Gareth Delany All-rounder |
6 | 10.2 | 1.0 | 7.35 | 25.33 | 20.7 | 8.7 | 41.9% | 0.0 | 2 |
6
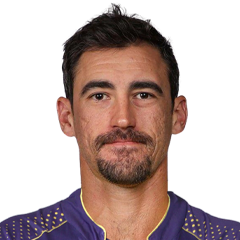  Mitchell Starc Bowler |
6 | 22.2 | 1.0 | 7.12 | 26.50 | 22.3 | 9.3 | 41.8% | 0.0 | 3 |
7
  Prakash Mishra All-rounder |
4 | 10 | 1.5 | 10.20 | 17.00 | 10.0 | 6.3 | 41.7% | 0.25 | 2 |
8
  Jasprit Bumrah Bowler |
5 | 21.2 | 1.2 | 6.05 | 21.50 | 21.3 | 10.6 | 41.4% | 0.20 | 3 |
9
 Aizaz Khan All-rounder |
5 | 20 | 1.6 | 6.30 | 15.75 | 15.0 | 9.8 | 40.8% | 0.0 | 2 |
10
 Shardul Thakur Bowler |
5 | 16.4 | 1.6 | 9.42 | 19.63 | 12.5 | 8.0 | 40.0% | 0.0 | 2 |
11
  Jofra Archer Bowler |
3 | 12.1 | 0.67 | 7.40 | 45.00 | 36.5 | 9.3 | 38.4% | 0.0 | 1 |
12
 Adil Rashid Bowler |
3 | 12.2 | 0.67 | 5.68 | 35.00 | 37.0 | 9.3 | 37.8% | 0.0 | 2 |
13
 Joshua Little Bowler |
6 | 16.5 | 0.80 | 8.55 | 36.00 | 25.3 | 7.6 | 37.6% | 0.0 | 3 |
14
 Kane Richardson Bowler |
6 | 18 | 0.83 | 6.72 | 24.20 | 21.6 | 6.7 | 37.0% | 0.0 | 2 |
15
 Craig Young Bowler |
5 | 16.2 | 0.80 | 7.04 | 28.75 | 24.5 | 7.2 | 36.7% | 0.0 | 2 |
|
16
R
Rohan Patel Bowler
|
4 | 10.1 | 1.0 | 7.77 | 19.75 | 15.3 | 5.5 | 36.1% | 0.0 | 2 |
17
 Simi Singh Batter |
6 | 17.1 | 1.0 | 8.85 | 25.33 | 17.2 | 6.2 | 35.9% | 0.0 | 2 |
18
 Ravindra Jadeja All-rounder |
3 | 10.2 | 1.3 | 5.71 | 14.75 | 15.5 | 7.3 | 35.5% | 0.0 | 2 |
19
 Mohammed Shami Bowler |
3 | 12.3 | 0.67 | 8.56 | 53.50 | 37.5 | 8.7 | 34.7% | 0.0 | 2 |
20
 Ashton Agar Bowler |
6 | 24 | 2.2 | 6.75 | 12.46 | 11.1 | 8.2 | 34.0% | 0.0 | 5 |
21
 Pat Cummins Bowler |
5 | 15.3 | 1.0 | 7.68 | 23.80 | 18.6 | 6.0 | 32.3% | 0.0 | 2 |
22
 Ehsan Khan Bowler |
4 | 12.3 | 0.25 | 7.76 | 97.00 | 75.0 | 6.0 | 32.0% | 0.0 | 1 |
23
 Adam Zampa Bowler |
6 | 21.3 | 1.3 | 8.33 | 22.38 | 16.1 | 6.8 | 31.8% | 0.0 | 2 |
24
 Aftab Hussain Bowler |
5 | 18 | 1.4 | 8.56 | 22.00 | 15.4 | 6.8 | 31.5% | 0.0 | 3 |
25
 Barry McCarthy Bowler |
4 | 10.4 | 0.25 | 10.41 | 111.00 | 64.0 | 4.8 | 29.7% | 0.0 | 1 |
26
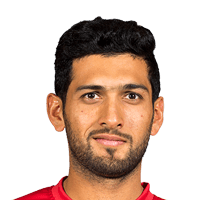 Sikandar Raza All-rounder |
4 | 10.2 | 0.25 | 8.52 | 88.00 | 62.0 | 4.3 | 27.4% | 0.0 | 1 |
27
 Yuzvendra Chahal Bowler |
5 | 20.2 | 0.60 | 8.21 | 55.67 | 40.7 | 6.4 | 26.2% | 0.0 | 1 |
28
 Tom Curran All-rounder |
3 | 10.3 | 0.67 | 11.05 | 58.00 | 31.5 | 5.0 | 23.8% | 0.0 | 1 |
29
 Chris Jordan Bowler |
3 | 12.5 | 1.0 | 8.65 | 37.00 | 25.7 | 5.7 | 22.1% | 0.0 | 1 |
T20 Internationals Stats Questions
T20 Internationals 2020 player and team stats: runs, averages and strike rates, wickets and economy, fielding and Dream11 points, and every side's batting, bowling and fielding. Statz tracks T20 Internationals 2020 across the points table, season leaderboards and venue scoring trends, updated after every completed match.
T20 Internationals on Statz
Frequently asked questions
Who scored the most runs in the T20 Internationals 2020?
Dawid Malan (England) with 363 runs in 8 matches, at a strike rate of 148.8.
Who took the most wickets in the T20 Internationals 2020?
Ashton Agar (Australia) with 13 wickets at 6.75 an over.
Who hit the most sixes in the T20 Internationals 2020?
Kieron Pollard with 17 sixes.