



























T20 Internationals 2019
InternationalT20 Internationals Player Bowling Average 2019
Every player ranked on bowling averages. Sorted on at least 10 overs.
Updated 11 December 2019, after India vs West Indies
| #Player | M | Overs | Wkts | Econ | Avg | SR | Dots | Dot % | Mdns | Best |
|---|---|---|---|---|---|---|---|---|---|---|
1
  Khawar Ali All-rounder |
4 | 11 | 9 | 5.45 | 6.67 | 7.3 | 26 | 39.4% | 0 | 4 |
2
 Aamir Kaleem All-rounder |
4 | 12.1 | 9 | 5.75 | 7.78 | 8.1 | 37 | 50.7% | 0 | 5 |
3
  Lasith Malinga Bowler |
3 | 12.4 | 7 | 5.37 | 9.71 | 10.9 | 36 | 47.4% | 1 | 5 |
4
 Mohammad Nadeem All-rounder |
4 | 12.3 | 7 | 5.44 | 9.71 | 10.7 | 38 | 50.7% | 0 | 3 |
5
  Rashid Khan Bowler |
6 | 24.3 | 14 | 6.12 | 10.71 | 10.5 | 53 | 36.1% | 0 | 5 |
6
  Sultan Ahmed Batter |
5 | 18.1 | 10 | 6.72 | 12.20 | 10.9 | 47 | 43.1% | 0 | 3 |
7
 Bilal Khan Bowler |
4 | 10 | 5 | 6.20 | 12.40 | 12.0 | 36 | 60.0% | 0 | 2 |
8
  Mark Adair Bowler |
4 | 15.1 | 9 | 8.18 | 13.78 | 10.1 | 37 | 40.7% | 0 | 4 |
9
  Mitchell Santner All-rounder |
8 | 28.2 | 15 | 7.52 | 14.20 | 11.3 | 62 | 36.5% | 0 | 3 |
10
 Zahoor Khan Bowler |
5 | 16.4 | 8 | 6.90 | 14.38 | 12.5 | 44 | 44.0% | 0 | 2 |
11
 Karim Janat All-rounder |
4 | 15.5 | 7 | 6.51 | 14.71 | 13.6 | 34 | 35.8% | 0 | 5 |
12
 Amir Hayat Bowler |
3 | 10.2 | 5 | 7.26 | 15.00 | 12.4 | 28 | 45.2% | 0 | 3 |
13
 Akila Dananjaya All-rounder |
3 | 11.3 | 6 | 8.17 | 15.67 | 11.5 | 25 | 36.2% | 0 | 3 |
14
  Deepak Chahar Bowler |
8 | 27.3 | 13 | 7.42 | 15.69 | 12.7 | 71 | 43.0% | 0 | 6 |
15
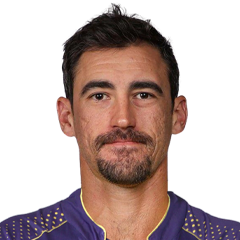  Mitchell Starc Bowler |
5 | 19.4 | 8 | 6.41 | 15.75 | 14.8 | 61 | 51.7% | 0 | 2 |
16
 Pat Cummins Bowler |
5 | 19.1 | 7 | 5.90 | 16.14 | 16.4 | 47 | 40.9% | 0 | 2 |
17
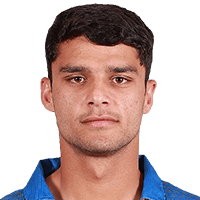 Naveen ul Haq Bowler |
3 | 10.4 | 5 | 7.69 | 16.40 | 12.8 | 25 | 39.1% | 0 | 3 |
18
  Brandon Glover Bowler |
7 | 19.2 | 10 | 9.16 | 17.70 | 11.6 | 52 | 44.8% | 0 | 4 |
19
 Gulbadin Naib All-rounder |
3 | 11.3 | 4 | 6.26 | 18.00 | 17.3 | 17 | 24.6% | 0 | 2 |
20
  Sheldon Cottrell Bowler |
6 | 21.3 | 8 | 6.70 | 18.00 | 16.1 | 60 | 46.5% | 0 | 3 |
21
 Kane Richardson Bowler |
6 | 22.3 | 8 | 6.58 | 18.50 | 16.9 | 68 | 50.4% | 0 | 3 |
22
  Pavandeep Singh Bowler |
7 | 19 | 10 | 10.11 | 19.20 | 11.4 | 52 | 45.6% | 0 | 3 |
23
 Ashton Agar Bowler |
6 | 23 | 7 | 5.87 | 19.29 | 19.7 | 35 | 25.4% | 0 | 2 |
24
 Mohammad Naveed Bowler |
5 | 17.2 | 6 | 6.75 | 19.50 | 17.3 | 43 | 41.3% | 1 | 2 |
25
 Lockie Ferguson Bowler |
5 | 20 | 7 | 7.00 | 20.00 | 17.1 | 53 | 44.2% | 0 | 2 |
26
 Pieter Seelaar Bowler |
8 | 16.1 | 9 | 11.20 | 20.11 | 10.8 | 30 | 30.9% | 0 | 3 |
27
 Muhammad Wafiq Bowler |
4 | 12.4 | 5 | 9.00 | 22.80 | 15.2 | 35 | 46.1% | 1 | 3 |
28
 Mujeeb Ur Rahman Bowler |
5 | 17.3 | 4 | 5.49 | 24.00 | 26.3 | 51 | 48.6% | 0 | 1 |
|
29
F
Fitri Sham Bowler
|
7 | 17 | 8 | 11.47 | 24.38 | 12.8 | 45 | 44.1% | 0 | 3 |
30
 Sharvin Muniandy Bowler |
7 | 14 | 7 | 12.29 | 24.57 | 12.0 | 25 | 29.8% | 0 | 2 |
31
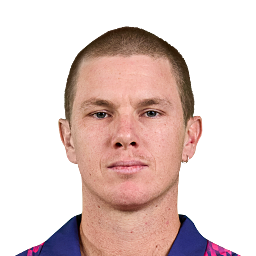 Adam Zampa Bowler |
5 | 19 | 5 | 6.58 | 25.00 | 22.8 | 32 | 28.1% | 0 | 3 |
32
 Oshane Thomas Bowler |
4 | 14.4 | 4 | 7.02 | 25.75 | 22.0 | 36 | 40.9% | 0 | 2 |
33
 Fabian Allen All-rounder |
4 | 12 | 3 | 6.67 | 26.67 | 24.0 | 31 | 43.1% | 1 | 2 |
34
 Craig Young Bowler |
3 | 12.2 | 4 | 8.68 | 26.75 | 18.5 | 29 | 39.2% | 0 | 2 |
35
 Vivian Kingma Bowler |
3 | 12.1 | 4 | 9.04 | 27.50 | 18.3 | 25 | 34.2% | 0 | 2 |
36
 Frederick Klaassen Bowler |
4 | 12 | 4 | 9.75 | 29.25 | 18.0 | 27 | 37.5% | 0 | 3 |
37
 Ravindra Jadeja All-rounder |
5 | 11.2 | 3 | 8.03 | 30.33 | 22.7 | 21 | 30.9% | 0 | 1 |
38
  Mohammad Amir Bowler |
3 | 12.3 | 3 | 7.36 | 30.67 | 25.0 | 32 | 42.7% | 0 | 3 |
39
 Imad Wasim All-rounder |
3 | 12.2 | 2 | 5.59 | 34.50 | 37.0 | 34 | 45.9% | 0 | 1 |
40
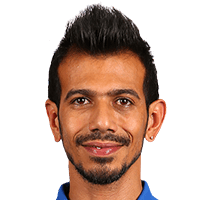 Yuzvendra Chahal Bowler |
7 | 26.1 | 7 | 9.29 | 34.71 | 22.4 | 46 | 29.3% | 0 | 2 |
41
 Sunil Narine Bowler |
3 | 12 | 2 | 5.92 | 35.50 | 36.0 | 28 | 38.9% | 0 | 2 |
42
 Tim Southee Bowler |
8 | 30.1 | 7 | 8.29 | 35.71 | 25.9 | 68 | 37.6% | 0 | 3 |
43
 Blair Tickner Bowler |
3 | 12.4 | 3 | 8.61 | 36.33 | 25.3 | 24 | 31.6% | 0 | 2 |
44
 Jason Holder All-rounder |
3 | 11.3 | 2 | 6.43 | 37.00 | 34.5 | 25 | 36.2% | 0 | 1 |
45
 Shivam Dube All-rounder |
6 | 11.4 | 3 | 9.77 | 38.00 | 23.3 | 22 | 31.4% | 0 | 3 |
46
 Gareth Delany All-rounder |
4 | 10.2 | 2 | 8.13 | 42.00 | 31.0 | 22 | 35.5% | 0 | 2 |
47
 Ish Sodhi Bowler |
8 | 25.3 | 6 | 10.31 | 43.83 | 25.5 | 33 | 21.6% | 0 | 2 |
48
 Shane Getkate Batter |
3 | 10.2 | 2 | 9.58 | 49.50 | 31.0 | 15 | 24.2% | 0 | 1 |
49
 Khaleel Ahmed Bowler |
3 | 12.3 | 2 | 8.64 | 54.00 | 37.5 | 29 | 38.7% | 0 | 1 |
50
 Carlos Brathwaite All-rounder |
6 | 14.5 | 2 | 8.56 | 63.50 | 44.5 | 23 | 25.8% | 0 | 1 |
51
 Mohammad Nabi All-rounder |
6 | 18.1 | 2 | 7.16 | 65.00 | 54.5 | 35 | 32.1% | 0 | 2 |
52
 Washington Sundar All-rounder |
8 | 26.1 | 3 | 7.45 | 65.00 | 52.3 | 62 | 39.5% | 0 | 1 |
53
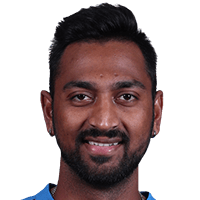 Krunal Pandya All-rounder |
6 | 19.5 | 1 | 7.36 | 146.00 | 119.0 | 26 | 21.8% | 0 | 1 |
54
 Scott Kuggeleijn All-rounder |
5 | 14 | 1 | 11.21 | 157.00 | 84.0 | 25 | 29.8% | 0 | 1 |
55
 Fayyaz Butt Bowler |
4 | 10 | 0 | 9.00 | - | - | 21 | 35.0% | 0 | 0 |
56
 Virandeep Singh Keeper |
7 | 12 | 0 | 7.33 | - | - | 27 | 37.5% | 0 | 0 |
T20 Internationals Stats Questions
T20 Internationals 2019 player and team stats: runs, averages and strike rates, wickets and economy, fielding and Dream11 points, and every side's batting, bowling and fielding. Statz tracks T20 Internationals 2019 across the points table, season leaderboards and venue scoring trends, updated after every completed match.
T20 Internationals on Statz
Frequently asked questions
Who scored the most runs in the T20 Internationals 2019?
Virat Kohli (India) with 465 runs in 10 matches, at a strike rate of 148.1.
Who took the most wickets in the T20 Internationals 2019?
Mitchell Santner (New Zealand) with 19 wickets at 6.97 an over.
Who hit the most sixes in the T20 Internationals 2019?
Virat Kohli with 23 sixes.