



























T20 World Cup 2007
InternationalT20 World Cup Player Stats 2007
Who is leading the way on runs, wickets, strike rates and much more.
Every leaderboard for the event: T20 World Cup stats.
Updated 24 September 2007, after India vs Pakistan
| #Player | M | Overs | Wkts | Econ | Avg | SR | Dots | Dot % | Mdns | Best |
|---|---|---|---|---|---|---|---|---|---|---|
1
  Stuart Clark Bowler |
6 | 24.5 | 12 | 5.80 | 12.00 | 12.4 | 73 | 49.0% | 0 | 4 |
2
 Mitchell Johnson Bowler |
6 | 25.3 | 8 | 6.00 | 19.13 | 19.1 | 69 | 45.1% | 0 | 3 |
3
  Morne Morkel Bowler |
4 | 17 | 8 | 5.88 | 12.50 | 12.8 | 48 | 47.1% | 0 | 4 |
4
 Nathan Bracken Bowler |
6 | 22.2 | 8 | 6.36 | 17.75 | 16.8 | 60 | 44.8% | 0 | 3 |
5
  Shahid Afridi All-rounder |
2 | 8.3 | 7 | 4.35 | 5.29 | 7.3 | 26 | 51.0% | 0 | 4 |
6
 Brett Lee Bowler |
6 | 25.2 | 7 | 6.75 | 24.43 | 21.7 | 61 | 40.1% | 0 | 3 |
7
 Umar Gul Bowler |
2 | 8.4 | 6 | 4.50 | 6.50 | 8.7 | 22 | 42.3% | 0 | 4 |
8
 Shaun Pollock Bowler |
4 | 16.3 | 6 | 9.09 | 25.00 | 16.5 | 34 | 34.3% | 0 | 3 |
9
  RP Singh Bowler |
3 | 13 | 6 | 6.00 | 13.00 | 13.0 | 39 | 50.0% | 0 | 3 |
10
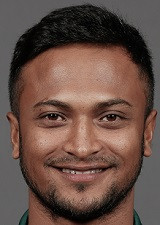  Shakib Al Hasan All-rounder |
3 | 11.1 | 5 | 6.54 | 14.60 | 13.4 | 27 | 40.3% | 0 | 4 |
11
 Abdur Razzak Bowler |
3 | 11.3 | 5 | 5.30 | 12.20 | 13.8 | 28 | 40.6% | 0 | 2 |
12
 Irfan Pathan Bowler |
3 | 10.3 | 5 | 4.95 | 10.40 | 12.6 | 30 | 47.6% | 1 | 3 |
|
13
J
Johan van der Wath All-rounder
|
4 | 16.4 | 5 | 7.20 | 24.00 | 20.0 | 36 | 36.0% | 0 | 2 |
14
 Vernon Philander Bowler |
4 | 11.3 | 4 | 7.13 | 20.50 | 17.3 | 34 | 49.3% | 0 | 2 |
15
 Syed Rasel Bowler |
3 | 11.1 | 3 | 6.27 | 23.33 | 22.3 | 34 | 50.7% | 2 | 1 |
16
 Harbhajan Singh Bowler |
3 | 11.2 | 3 | 8.12 | 30.67 | 22.7 | 22 | 32.4% | 0 | 2 |
17
  Jimmy Kamande Bowler |
2 | 4.1 | 3 | 11.52 | 16.00 | 8.3 | 7 | 28.0% | 0 | 3 |
18
  Daniel Vettori Bowler |
2 | 8 | 3 | 5.63 | 15.00 | 16.0 | 23 | 47.9% | 0 | 2 |
19
 Mohammad Asif Bowler |
2 | 8.2 | 3 | 9.00 | 25.00 | 16.7 | 19 | 38.0% | 0 | 2 |
20
  Dimitri Mascarenhas All-rounder |
3 | 9 | 3 | 8.44 | 25.33 | 18.0 | 20 | 37.0% | 0 | 3 |
|
21
D
Darren Maddy All-rounder
|
3 | 3 | 3 | 8.67 | 8.67 | 6.0 | 7 | 38.9% | 0 | 2 |
22
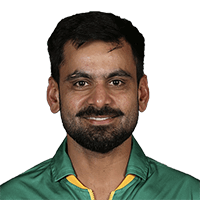 Mohammad Hafeez All-rounder |
2 | 8.3 | 2 | 8.24 | 35.00 | 25.5 | 14 | 27.5% | 0 | 1 |
23
 Stuart Broad Bowler |
3 | 12.3 | 2 | 9.92 | 62.00 | 37.5 | 27 | 36.0% | 0 | 1 |
24
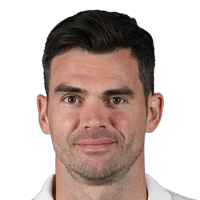 James Anderson Bowler |
3 | 12.1 | 2 | 6.58 | 40.00 | 36.5 | 26 | 35.6% | 0 | 2 |
25
 Mohammad Mahmudullah All-rounder |
2 | 8.1 | 2 | 5.76 | 23.50 | 24.5 | 15 | 30.6% | 0 | 1 |
26
 Mashrafe Mortaza Bowler |
3 | 10.4 | 2 | 9.38 | 50.00 | 32.0 | 23 | 35.9% | 0 | 1 |
27
 Michael Clarke Batter |
5 | 7.2 | 2 | 9.82 | 36.00 | 22.0 | 12 | 27.3% | 0 | 1 |
28
 Makhaya Ntini Bowler |
3 | 8.2 | 2 | 9.60 | 40.00 | 25.0 | 23 | 46.0% | 0 | 1 |
29
 Shanthakumaran Sreesanth Bowler |
3 | 11.4 | 2 | 9.43 | 55.00 | 35.0 | 34 | 48.6% | 1 | 1 |
30
 Paul Collingwood All-rounder |
3 | 6.1 | 2 | 10.70 | 33.00 | 18.5 | 7 | 18.9% | 0 | 1 |
31
 Andrew Flintoff All-rounder |
3 | 10.1 | 2 | 6.10 | 31.00 | 30.5 | 24 | 39.3% | 0 | 1 |
32
 Thomas Odoyo All-rounder |
2 | 6.4 | 2 | 5.40 | 18.00 | 20.0 | 23 | 57.5% | 0 | 1 |
33
 Scott Styris All-rounder |
2 | 6 | 2 | 5.00 | 15.00 | 18.0 | 18 | 50.0% | 0 | 1 |
34
 Chris Tremlett Bowler |
1 | 4.3 | 2 | 10.00 | 22.50 | 13.5 | 8 | 29.6% | 0 | 2 |
|
35
C
Chris Schofield Bowler
|
2 | 5 | 2 | 5.40 | 13.50 | 15.0 | 10 | 33.3% | 0 | 2 |
|
36
J
Joginder Sharma All-rounder
|
1 | 3.5 | 2 | 5.22 | 10.00 | 11.5 | 12 | 52.2% | 0 | 2 |
37
 Albie Morkel All-rounder |
4 | 8.4 | 1 | 7.50 | 65.00 | 52.0 | 19 | 36.5% | 0 | 1 |
38
 Sohail Tanvir Bowler |
1 | 4.4 | 1 | 5.57 | 26.00 | 28.0 | 12 | 42.9% | 0 | 1 |
39
 Shane Watson All-rounder |
1 | 3.3 | 1 | 5.43 | 19.00 | 21.0 | 7 | 33.3% | 0 | 1 |
40
 Mohammad Ashraful Batter |
3 | 6.1 | 1 | 11.19 | 69.00 | 37.0 | 7 | 18.9% | 0 | 1 |
41
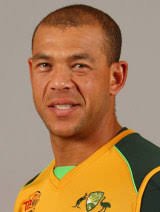 Andrew Symonds All-rounder |
6 | 12 | 1 | 9.58 | 115.00 | 72.0 | 14 | 19.4% | 0 | 1 |
42
 Yuvraj Singh All-rounder |
3 | 3 | 1 | 12.67 | 38.00 | 18.0 | 4 | 22.2% | 0 | 1 |
43
 Ajit Agarkar Bowler |
2 | 8 | 1 | 9.38 | 75.00 | 48.0 | 15 | 31.3% | 0 | 1 |
44
 Nehemiah Odhiambo Bowler |
2 | 5.2 | 1 | 12.19 | 65.00 | 32.0 | 5 | 15.6% | 0 | 1 |
45
 Shane Bond Bowler |
2 | 8.1 | 1 | 9.55 | 78.00 | 49.0 | 21 | 42.9% | 0 | 1 |
46
 Jeetan Patel Bowler |
1 | 3.5 | 1 | 8.35 | 32.00 | 23.0 | 7 | 30.4% | 0 | 1 |
47
 Shoaib Malik All-rounder |
2 | 1 | 0 | 3.00 | - | - | 3 | 50.0% | 0 | 0 |
48
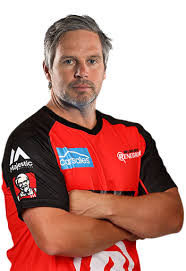 Brad Hodge Batter |
4 | 2 | 0 | 10.00 | - | - | 5 | 41.7% | 0 | 0 |
49
 Farhad Reza All-rounder |
1 | 2 | 0 | 11.00 | - | - | 3 | 25.0% | 0 | 0 |
50
 Graeme Smith Batter |
4 | 1 | 0 | 16.00 | - | - | 1 | 16.7% | 0 | 0 |
51
 Andre Nel Bowler |
1 | 4 | 0 | 5.75 | - | - | 12 | 50.0% | 0 | 0 |
52
 Steve Tikolo All-rounder |
2 | 1.2 | 0 | 18.75 | - | - | 1 | 12.5% | 0 | 0 |
53
 Rajesh Bhudia Batter |
1 | 0.4 | 0 | 25.50 | - | - | 0 | 0.0% | 0 | 0 |
54
 Peter Ongondo Bowler |
2 | 7.3 | 0 | 10.00 | - | - | 16 | 35.6% | 0 | 0 |
55
 Lameck Onyango Bowler |
1 | 4 | 0 | 15.25 | - | - | 4 | 16.7% | 0 | 0 |
56
 Mark Gillespie Bowler |
2 | 6.1 | 0 | 9.57 | - | - | 13 | 35.1% | 0 | 0 |
57
 Jacob Oram All-rounder |
2 | 3 | 0 | 12.00 | - | - | 6 | 33.3% | 0 | 0 |
58
 Chris Martin Bowler |
1 | 3 | 0 | 7.67 | - | - | 9 | 50.0% | 0 | 0 |
59
 Yasir Arafat All-rounder |
1 | 3 | 0 | 4.67 | - | - | 8 | 44.4% | 0 | 0 |
60
 Yusuf Pathan All-rounder |
1 | 1 | 0 | 5.00 | - | - | 1 | 16.7% | 0 | 0 |
T20 World Cup Stats Questions
T20 World Cup 2007 player and team stats: runs, averages and strike rates, wickets and economy, fielding and Dream11 points, and every side's batting, bowling and fielding. Statz tracks T20 World Cup 2007 across the points table, season leaderboards and venue scoring trends, updated after every completed match.
T20 World Cup on Statz
Frequently asked questions
Who scored the most runs in the T20 World Cup 2007?
Matthew Hayden (Australia) with 265 runs in 6 matches, at a strike rate of 144.8.
Who took the most wickets in the T20 World Cup 2007?
Umar Gul (Pakistan) with 13 wickets at 5.34 an over.
Who hit the most sixes in the T20 World Cup 2007?
Craig McMillan with 13 sixes.