




























SA20 2024
 South Africa
SA20 Player Stats 2024
Who is leading the way on runs, wickets, strike rates and much more. Sorted on at least 3 matches.
Updated 10 February 2024, after Sunrisers Eastern Cape vs Durban's Super Giants
| #Player | M | Overs | Wkts | Econ | Avg | SR | Dots | Dot % | Mdns | Best |
|---|---|---|---|---|---|---|---|---|---|---|
1
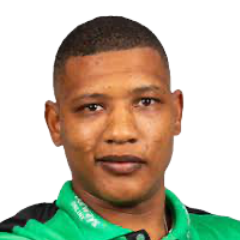  Ottneil Baartman Bowler |
8 | 31.3 | 2.3 | 6.73 | 11.78 | 10.5 | 10.6 | 45.0% | 0.13 | 4 |
2
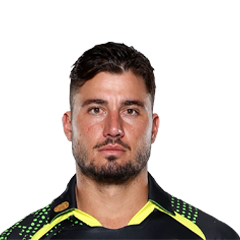  Marcus Stoinis All-rounder |
5 | 18.4 | 2.0 | 6.86 | 12.80 | 11.2 | 9.4 | 42.0% | 0.0 | 3 |
3
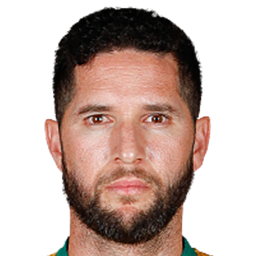  Wayne Parnell Bowler |
7 | 23.3 | 2.0 | 10.34 | 17.36 | 10.1 | 8.0 | 39.7% | 0.14 | 4 |
4
 Marco Jansen All-rounder |
10 | 38.2 | 2.0 | 7.46 | 14.30 | 11.5 | 11.2 | 48.7% | 0.10 | 5 |
5
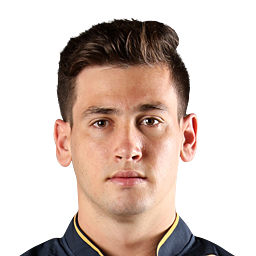 Noor Ahmad Bowler |
6 | 24.3 | 2.0 | 5.55 | 11.33 | 12.3 | 11.7 | 47.6% | 0.17 | 5 |
6
  Lizaad Williams Bowler |
8 | 28 | 1.9 | 8.86 | 16.53 | 11.2 | 7.8 | 36.9% | 0.0 | 4 |
7
 Junior Dala Bowler |
7 | 20.5 | 1.9 | 8.59 | 13.77 | 9.6 | 6.1 | 34.4% | 0.0 | 5 |
8
 Richard Gleeson Bowler |
3 | 13 | 1.7 | 7.77 | 20.20 | 15.6 | 10.7 | 41.0% | 0.0 | 2 |
9
  Nuwan Thushara Bowler |
5 | 17.5 | 1.6 | 8.64 | 19.25 | 13.4 | 7.2 | 33.6% | 0.0 | 3 |
10
 Daniel Worrall Bowler |
11 | 43.2 | 1.5 | 7.02 | 17.88 | 15.3 | 11.3 | 47.7% | 0.0 | 3 |
11
  Lungi Ngidi Bowler |
9 | 36.5 | 1.4 | 8.93 | 25.31 | 17.0 | 10.0 | 40.7% | 0.0 | 4 |
12
 Daryn Dupavillon Bowler |
7 | 25.4 | 1.3 | 8.77 | 25.00 | 17.1 | 9.9 | 44.8% | 0.0 | 3 |
13
 Keshav Maharaj Bowler |
13 | 42.5 | 1.2 | 7.17 | 20.47 | 17.1 | 7.2 | 36.2% | 0.0 | 2 |
14
 Nandre Burger Bowler |
10 | 35.4 | 1.1 | 7.79 | 25.27 | 19.5 | 9.2 | 43.0% | 0.0 | 3 |
15
 Reece Topley Bowler |
12 | 41.1 | 1.1 | 7.99 | 25.31 | 19.0 | 9.0 | 43.7% | 0.17 | 3 |
16
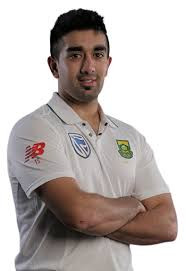 Tabraiz Shamsi Bowler |
10 | 39 | 1.0 | 7.31 | 28.50 | 23.4 | 7.8 | 33.3% | 0.10 | 2 |
17
 Olly Stone Bowler |
5 | 16.4 | 1.0 | 9.54 | 31.80 | 20.0 | 7.0 | 35.0% | 0.0 | 2 |
18
 Doug Bracewell Bowler |
4 | 11.2 | 1.0 | 9.35 | 26.50 | 17.0 | 4.5 | 26.5% | 0.0 | 2 |
19
 Dwaine Pretorius All-rounder |
9 | 22.5 | 1.0 | 8.85 | 22.44 | 15.2 | 4.0 | 26.3% | 0.0 | 2 |
20
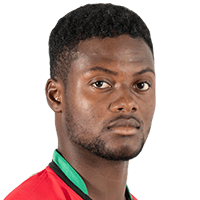 Romario Shepherd All-rounder |
5 | 15.3 | 1.0 | 9.87 | 30.60 | 18.6 | 6.0 | 32.3% | 0.0 | 3 |
21
 Thomas Kaber All-rounder |
7 | 17.2 | 1.0 | 7.73 | 19.14 | 14.9 | 4.9 | 32.7% | 0.0 | 3 |
22
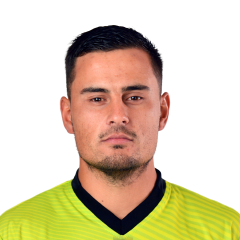 Beyers Swanepoel All-rounder |
5 | 15.2 | 1.0 | 7.96 | 24.40 | 18.4 | 6.8 | 37.0% | 0.0 | 2 |
23
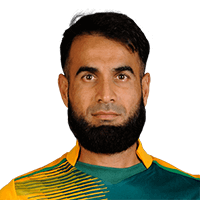 Imran Tahir Bowler |
10 | 31.4 | 0.90 | 7.45 | 26.22 | 21.1 | 6.5 | 34.2% | 0.0 | 2 |
24
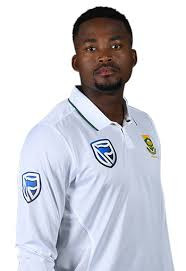 Andile Phehlukwayo All-rounder |
10 | 30.3 | 0.90 | 8.85 | 30.00 | 20.3 | 5.0 | 27.3% | 0.0 | 3 |
25
 Kagiso Rabada Bowler |
10 | 34 | 0.90 | 8.56 | 32.33 | 22.7 | 7.7 | 37.7% | 0.0 | 2 |
26
 Obed McCoy Bowler |
10 | 37.5 | 0.90 | 8.46 | 35.56 | 25.2 | 8.8 | 38.8% | 0.10 | 2 |
27
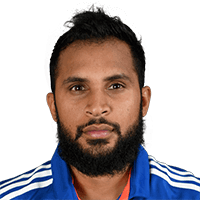 Adil Rashid Bowler |
9 | 30.4 | 0.89 | 8.12 | 31.13 | 23.0 | 6.2 | 30.4% | 0.0 | 3 |
28
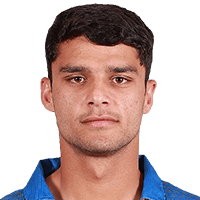 Naveen ul Haq Bowler |
9 | 31.5 | 0.89 | 8.04 | 32.00 | 23.9 | 7.2 | 34.0% | 0.0 | 2 |
29
 Liam Dawson Bowler |
10 | 36.1 | 0.80 | 7.49 | 33.88 | 27.1 | 8.4 | 38.7% | 0.0 | 2 |
30
 George Linde All-rounder |
9 | 29 | 0.78 | 7.76 | 32.14 | 24.9 | 7.1 | 36.8% | 0.0 | 2 |
31
 Senuran Muthusamy Batter |
4 | 7.2 | 0.75 | 6.68 | 16.33 | 14.7 | 3.3 | 29.5% | 0.0 | 3 |
32
 Beuran Hendricks Bowler |
3 | 8.4 | 0.67 | 9.12 | 39.50 | 26.0 | 6.7 | 38.5% | 0.0 | 1 |
33
 Hardus Viljoen Bowler |
3 | 12 | 0.67 | 10.42 | 62.50 | 36.0 | 6.7 | 27.8% | 0.0 | 2 |
34
 James Neesham All-rounder |
6 | 11.3 | 0.67 | 9.04 | 26.00 | 17.3 | 3.8 | 33.3% | 0.0 | 1 |
35
 Will Jacks Batter |
9 | 23.3 | 0.67 | 6.30 | 24.67 | 23.5 | 5.7 | 36.2% | 0.0 | 2 |
36
 Sam Curran All-rounder |
10 | 33.3 | 0.60 | 9.43 | 52.67 | 33.5 | 5.4 | 26.9% | 0.0 | 1 |
37
 Simon Harmer Bowler |
10 | 29.2 | 0.60 | 7.88 | 38.50 | 29.3 | 6.0 | 34.1% | 0.0 | 4 |
38
 Bjorn Fortuin Bowler |
11 | 41.3 | 0.55 | 7.06 | 48.83 | 41.5 | 8.3 | 36.5% | 0.09 | 3 |
39
 Keemo Paul All-rounder |
6 | 14.1 | 0.50 | 10.52 | 49.67 | 28.3 | 3.2 | 22.4% | 0.0 | 2 |
40
 Moeen Ali All-rounder |
10 | 24.2 | 0.50 | 8.05 | 39.20 | 29.2 | 4.8 | 32.9% | 0.0 | 2 |
41
 Corbin Bosch All-rounder |
4 | 7.1 | 0.50 | 10.19 | 36.50 | 21.5 | 3.3 | 30.2% | 0.0 | 2 |
42
 Eathan Bosch Bowler |
9 | 29.1 | 0.44 | 8.16 | 59.50 | 43.8 | 7.8 | 40.0% | 0.0 | 2 |
43
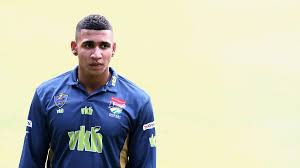 Patrick Kruger All-rounder |
9 | 8.2 | 0.44 | 6.36 | 13.25 | 12.5 | 2.8 | 50.0% | 0.0 | 3 |
44
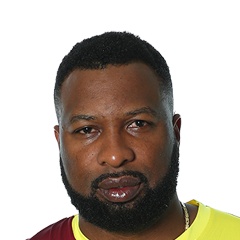 Kieron Pollard All-rounder |
10 | 12.1 | 0.40 | 8.79 | 26.75 | 18.3 | 1.5 | 20.5% | 0.0 | 2 |
45
 JJ Smuts All-rounder |
12 | 14.2 | 0.33 | 7.47 | 26.75 | 21.5 | 2.3 | 31.4% | 0.0 | 2 |
46
 Liam Livingstone All-rounder |
9 | 14.1 | 0.33 | 9.81 | 46.33 | 28.3 | 2.8 | 29.4% | 0.0 | 1 |
47
 Colin Ackermann All-rounder |
3 | 1 | 0.33 | 13.00 | 13.00 | 6.0 | 0.33 | 16.7% | 0.0 | 1 |
48
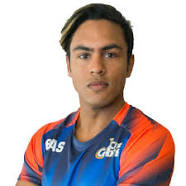 Dayyaan Galiem All-rounder |
3 | 8.1 | 0.33 | 9.06 | 74.00 | 49.0 | 3.7 | 22.4% | 0.0 | 1 |
|
49
C
Codi Yusuf All-rounder
|
3 | 6.3 | 0.33 | 9.38 | 61.00 | 39.0 | 3.7 | 28.2% | 0.0 | 1 |
50
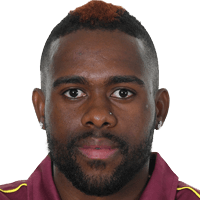 Fabian Allen All-rounder |
7 | 8 | 0.29 | 8.88 | 35.50 | 24.0 | 1.7 | 25.0% | 0.0 | 1 |
51
 Wihan Lubbe All-rounder |
11 | 9 | 0.18 | 5.67 | 25.50 | 27.0 | 2.2 | 44.4% | 0.0 | 1 |
52
 Wiaan Mulder All-rounder |
12 | 12.3 | 0.17 | 9.12 | 57.00 | 37.5 | 2.3 | 36.0% | 0.0 | 1 |
53
 Aiden Markram Batter |
11 | 7.1 | 0.09 | 5.72 | 41.00 | 43.0 | 1.5 | 37.2% | 0.0 | 1 |
54
 David Wiese All-rounder |
3 | 8.3 | 0.0 | 10.00 | - | - | 4.0 | 23.5% | 0.0 | 0 |
SA20 Stats Questions
SA20 2024 player and team stats: runs, averages and strike rates, wickets and economy, fielding and Dream11 points, and every side's batting, bowling and fielding. Statz tracks SA20 2024 across the points table, season leaderboards and venue scoring trends, updated after every completed match.
SA20 on Statz
Frequently asked questions
Who scored the most runs in the SA20 2024?
Ryan Rickelton (MI Cape Town) with 530 runs in 10 matches, at a strike rate of 173.8.
Who took the most wickets in the SA20 2024?
Marco Jansen (Sunrisers Eastern Cape) with 20 wickets at 7.46 an over.
Who hit the most sixes in the SA20 2024?
Heinrich Klaasen with 37 sixes.