



























SA20 2025
 South Africa
SA20 Player Dot Balls 2025
Every player ranked on dot balls.
Updated 8 February 2025, after MI Cape Town vs Sunrisers Eastern Cape
| #Player | M | Overs | Wkts | Econ | Avg | SR | Dots | Dot % | Mdns | Best |
|---|---|---|---|---|---|---|---|---|---|---|
1
  Marco Jansen All-rounder |
6 | 26.1 | 14 | 5.58 | 10.43 | 11.2 | 81 | 51.6% | 0 | 4 |
2
  Kagiso Rabada Bowler |
6 | 22.3 | 10 | 6.09 | 13.70 | 13.5 | 72 | 53.3% | 2 | 4 |
3
 Trent Boult Bowler |
6 | 24.3 | 6 | 6.49 | 26.50 | 24.5 | 67 | 45.6% | 0 | 2 |
4
 George Linde All-rounder |
7 | 25.3 | 10 | 5.84 | 14.90 | 15.3 | 65 | 42.5% | 0 | 3 |
5
  Mujeeb Ur Rahman Bowler |
6 | 24.2 | 8 | 6.74 | 20.50 | 18.3 | 58 | 39.7% | 1 | 2 |
6
 Rashid Khan Bowler |
6 | 24 | 9 | 7.13 | 19.00 | 16.0 | 53 | 36.8% | 0 | 2 |
7
 Richard Gleeson Bowler |
6 | 21 | 8 | 7.57 | 19.88 | 15.8 | 51 | 40.5% | 0 | 2 |
8
 Bjorn Fortuin Bowler |
6 | 24.1 | 6 | 6.33 | 25.50 | 24.2 | 50 | 34.5% | 1 | 2 |
9
 Ottneil Baartman Bowler |
5 | 18.1 | 7 | 6.83 | 17.71 | 15.6 | 50 | 45.9% | 0 | 2 |
10
 Liam Dawson Bowler |
6 | 18 | 10 | 6.22 | 11.20 | 10.8 | 49 | 45.4% | 0 | 3 |
11
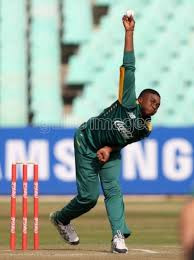  Lutho Sipamla Bowler |
4 | 15.1 | 8 | 5.74 | 10.88 | 11.4 | 48 | 52.7% | 2 | 3 |
12
 Dunith Wellalage Bowler |
5 | 19.2 | 3 | 5.79 | 37.33 | 38.7 | 45 | 38.8% | 1 | 1 |
13
 Kwena Maphaka Bowler |
5 | 17 | 5 | 8.82 | 30.00 | 20.4 | 42 | 41.2% | 0 | 2 |
14
  Noor Ahmad Bowler |
4 | 17.1 | 7 | 6.87 | 16.86 | 14.7 | 38 | 36.9% | 0 | 4 |
15
 Corbin Bosch All-rounder |
5 | 16.4 | 9 | 8.46 | 15.67 | 11.1 | 37 | 37.0% | 0 | 4 |
16
 Hardus Viljoen Bowler |
3 | 12.4 | 7 | 7.18 | 13.00 | 10.9 | 35 | 46.1% | 0 | 4 |
17
  Will Jacks Batter |
4 | 10.1 | 1 | 5.61 | 57.00 | 61.0 | 33 | 54.1% | 1 | 1 |
18
 Migael Pretorius Bowler |
4 | 15.1 | 4 | 9.30 | 35.25 | 22.8 | 32 | 35.2% | 1 | 3 |
19
 Eathan Bosch Bowler |
3 | 10.4 | 2 | 6.47 | 34.50 | 32.0 | 31 | 48.4% | 0 | 2 |
20
 Chris Woakes All-rounder |
4 | 14.2 | 5 | 9.35 | 26.80 | 17.2 | 28 | 32.6% | 0 | 2 |
21
 Craig Overton Bowler |
2 | 8 | 5 | 4.38 | 7.00 | 9.6 | 28 | 58.3% | 1 | 3 |
22
 Keshav Maharaj Bowler |
4 | 16 | 3 | 7.06 | 37.67 | 32.0 | 28 | 29.2% | 0 | 2 |
23
 Simon Harmer Bowler |
4 | 15.1 | 2 | 7.19 | 54.50 | 45.5 | 28 | 30.8% | 0 | 1 |
24
 Evan Jones All-rounder |
3 | 8.2 | 1 | 6.00 | 50.00 | 50.0 | 25 | 50.0% | 0 | 1 |
25
 Joe Root Batter |
5 | 14.1 | 4 | 7.41 | 26.25 | 21.3 | 24 | 28.2% | 0 | 2 |
26
 Naveen ul Haq Bowler |
4 | 16 | 3 | 9.81 | 52.33 | 32.0 | 23 | 24.0% | 0 | 1 |
27
 Senuran Muthusamy Batter |
4 | 13.2 | 5 | 7.80 | 20.80 | 16.0 | 22 | 27.5% | 0 | 2 |
28
 Thomas Stewart Rogers All-rounder |
2 | 8.1 | 2 | 9.06 | 37.00 | 24.5 | 21 | 42.9% | 0 | 1 |
29
 Donovan Ferreira Keeper |
4 | 8.1 | 3 | 5.27 | 14.33 | 16.3 | 21 | 42.9% | 0 | 3 |
|
30
G
Gideon Peters Bowler
|
2 | 8.1 | 3 | 7.10 | 19.33 | 16.3 | 20 | 40.8% | 0 | 2 |
31
 James Neesham All-rounder |
2 | 7.4 | 3 | 6.65 | 17.00 | 15.3 | 18 | 39.1% | 0 | 2 |
32
 Imran Tahir Bowler |
2 | 8 | 2 | 5.50 | 22.00 | 24.0 | 17 | 35.4% | 0 | 1 |
33
 Matheesha Pathirana Bowler |
3 | 10.2 | 1 | 8.71 | 90.00 | 62.0 | 17 | 27.4% | 0 | 1 |
34
 Dayyaan Galiem All-rounder |
5 | 11.4 | 2 | 9.94 | 58.00 | 35.0 | 15 | 21.4% | 0 | 1 |
35
 Aiden Markram Batter |
6 | 8.1 | 3 | 6.49 | 17.67 | 16.3 | 13 | 26.5% | 0 | 2 |
36
 David Wiese All-rounder |
1 | 4 | 1 | 4.75 | 19.00 | 24.0 | 13 | 54.2% | 0 | 1 |
37
 Daryn Dupavillon Bowler |
1 | 4.1 | 3 | 7.68 | 10.67 | 8.3 | 13 | 52.0% | 1 | 3 |
38
 Junior Dala Bowler |
1 | 4 | 2 | 9.50 | 19.00 | 12.0 | 10 | 41.7% | 0 | 2 |
39
 Dane Piedt Bowler |
1 | 4 | 3 | 7.00 | 9.33 | 8.0 | 10 | 41.7% | 0 | 3 |
40
 Prenelan Subrayen All-rounder |
1 | 4 | 2 | 6.00 | 12.00 | 12.0 | 10 | 41.7% | 0 | 2 |
41
 Tabraiz Shamsi Bowler |
2 | 5.1 | 1 | 8.52 | 44.00 | 31.0 | 9 | 29.0% | 0 | 1 |
42
 Moeen Ali All-rounder |
2 | 4 | 0 | 8.00 | - | - | 9 | 37.5% | 0 | 0 |
43
 Maheesh Theekshana Bowler |
1 | 4 | 0 | 9.00 | - | - | 9 | 37.5% | 0 | 0 |
44
 Beyers Swanepoel All-rounder |
1 | 4.2 | 1 | 9.46 | 41.00 | 26.0 | 8 | 30.8% | 0 | 1 |
45
 Matty Potts All-rounder |
1 | 2 | 0 | 7.00 | - | - | 7 | 58.3% | 0 | 0 |
46
 Wiaan Mulder All-rounder |
4 | 4.2 | 0 | 9.92 | - | - | 7 | 26.9% | 0 | 0 |
47
 Dewald Brevis Batter |
7 | 4.1 | 2 | 6.48 | 13.50 | 12.5 | 7 | 28.0% | 0 | 1 |
48
 Azmatullah Omarzai All-rounder |
1 | 3 | 1 | 10.67 | 32.00 | 18.0 | 6 | 33.3% | 0 | 1 |
49
 Thomas Kaber All-rounder |
1 | 3 | 3 | 9.00 | 9.00 | 6.0 | 6 | 33.3% | 0 | 3 |
|
50
T
Tiaan van Vuuren All-rounder
|
1 | 4 | 0 | 12.75 | - | - | 6 | 25.0% | 0 | 0 |
|
51
N
Nqabayomzi Peter Bowler
|
1 | 4.1 | 0 | 7.92 | - | - | 6 | 24.0% | 0 | 0 |
52
 Reeza Hendricks Batter |
7 | 2 | 2 | 3.50 | 3.50 | 6.0 | 5 | 41.7% | 0 | 2 |
53
 Lungi Ngidi Bowler |
1 | 4 | 0 | 10.50 | - | - | 5 | 20.8% | 0 | 0 |
54
 Andile Phehlukwayo All-rounder |
2 | 2.1 | 0 | 9.23 | - | - | 5 | 38.5% | 0 | 0 |
55
 Dwaine Pretorius All-rounder |
1 | 2.1 | 0 | 10.15 | - | - | 3 | 23.1% | 0 | 0 |
56
 Mitchell Owen All-rounder |
1 | 1 | 0 | 8.00 | - | - | 3 | 50.0% | 0 | 0 |
57
 Tristan Luus Bowler |
1 | 2.2 | 0 | 7.71 | - | - | 3 | 21.4% | 0 | 0 |
58
 Sibonelo Makhanya Batter |
1 | 1.1 | 0 | 8.57 | - | - | 2 | 28.6% | 0 | 0 |
59
 Wihan Lubbe All-rounder |
4 | 1.1 | 0 | 18.86 | - | - | 2 | 28.6% | 0 | 0 |
60
 Bryce Parsons All-rounder |
2 | 3 | 0 | 8.33 | - | - | 2 | 11.1% | 0 | 0 |
61
 Delano Potgieter All-rounder |
5 | 1 | 0 | 13.00 | - | - | 1 | 16.7% | 0 | 0 |
SA20 Stats Questions
SA20 2025 player and team stats: runs, averages and strike rates, wickets and economy, fielding and Dream11 points, and every side's batting, bowling and fielding. Statz tracks SA20 2025 across the points table, season leaderboards and venue scoring trends, updated after every completed match.
SA20 on Statz
Frequently asked questions
Who scored the most runs in the SA20 2025?
Lhuan-dre Pretorius (Paarl Royals) with 397 runs in 12 matches, at a strike rate of 166.8.
Who took the most wickets in the SA20 2025?
Marco Jansen (Sunrisers Eastern Cape) with 19 wickets at 6.82 an over.
Who hit the most sixes in the SA20 2025?
Dewald Brevis with 25 sixes.