




























SA20 2023
 South Africa
SA20 Player Dot Ball Percentage 2023
Every player ranked on dot ball percentages. Sorted on at least 10 overs.
Updated 12 February 2023, after Pretoria Capitals vs Sunrisers Eastern Cape
| #Player | M | Overs | Wkts | Econ | Avg | SR | Dots | Dot % | Mdns | Best |
|---|---|---|---|---|---|---|---|---|---|---|
1
  Anrich Nortje Bowler |
5 | 19.1 | 1.8 | 5.95 | 12.67 | 12.8 | 12.4 | 53.9% | 0.20 | 3 |
2
 Eathan Bosch Bowler |
5 | 17.3 | 1.4 | 6.23 | 15.57 | 15.0 | 10.8 | 51.4% | 0.0 | 3 |
3
  Sam Curran All-rounder |
4 | 13.1 | 1.8 | 7.90 | 14.86 | 11.3 | 9.5 | 48.1% | 0.25 | 3 |
4
  Reece Topley Bowler |
4 | 16.1 | 1.3 | 6.80 | 22.00 | 19.4 | 11.5 | 47.4% | 0.0 | 2 |
5
 Wayne Parnell Bowler |
5 | 16.3 | 1.4 | 7.70 | 18.14 | 14.1 | 9.0 | 45.5% | 0.20 | 3 |
6
 George Linde All-rounder |
5 | 11.2 | 0.60 | 7.41 | 28.00 | 22.7 | 6.0 | 44.1% | 0.0 | 2 |
7
  Gerald Coetzee All-rounder |
3 | 10 | 2.3 | 7.30 | 10.43 | 8.6 | 8.7 | 43.3% | 0.0 | 4 |
8
 Kagiso Rabada Bowler |
5 | 19.2 | 1.2 | 7.03 | 22.67 | 19.3 | 9.6 | 41.4% | 0.20 | 3 |
9
 Alzarri Joseph Bowler |
5 | 18.1 | 0.40 | 7.60 | 69.00 | 54.5 | 9.0 | 41.3% | 0.0 | 2 |
10
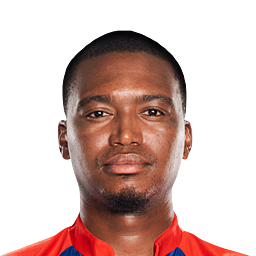  Lungi Ngidi Bowler |
4 | 17 | 1.3 | 7.82 | 26.60 | 20.4 | 10.5 | 41.2% | 0.0 | 2 |
11
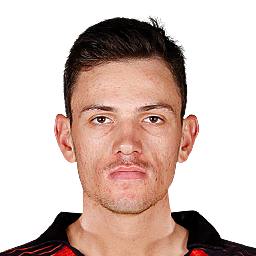  Marco Jansen All-rounder |
6 | 22.2 | 0.67 | 7.52 | 42.00 | 33.5 | 9.0 | 40.3% | 0.0 | 1 |
12
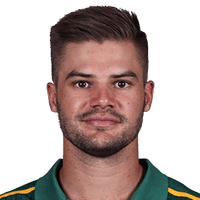 Aiden Markram Batter |
6 | 14.1 | 1.0 | 6.14 | 14.50 | 14.2 | 5.5 | 38.8% | 0.0 | 2 |
13
 Aaron Phangiso Bowler |
5 | 16 | 1.2 | 6.81 | 18.17 | 16.0 | 7.4 | 38.5% | 0.0 | 4 |
14
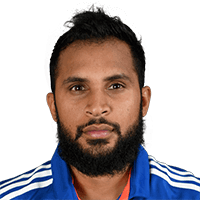 Adil Rashid Bowler |
5 | 20.3 | 1.0 | 7.71 | 31.60 | 24.6 | 9.4 | 38.2% | 0.20 | 2 |
15
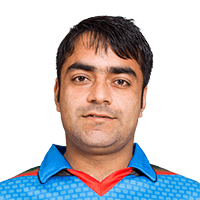 Rashid Khan Bowler |
5 | 20.4 | 0.60 | 5.90 | 40.67 | 41.3 | 9.2 | 37.1% | 0.0 | 1 |
16
 Brydon Carse Bowler |
6 | 17.4 | 0.83 | 9.57 | 33.80 | 21.2 | 6.5 | 36.8% | 0.0 | 2 |
17
 Prenelan Subrayen All-rounder |
3 | 11 | 1.0 | 7.36 | 27.00 | 22.0 | 8.0 | 36.4% | 0.0 | 2 |
18
 Sisanda Magala Bowler |
6 | 23.4 | 1.5 | 8.11 | 21.33 | 15.8 | 8.3 | 35.2% | 0.17 | 2 |
19
 Hardus Viljoen Bowler |
3 | 10.3 | 1.0 | 9.52 | 33.33 | 21.0 | 7.3 | 34.9% | 0.0 | 2 |
20
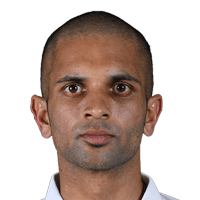 Keshav Maharaj Bowler |
4 | 14.2 | 0.25 | 8.23 | 118.00 | 86.0 | 7.5 | 34.9% | 0.0 | 1 |
21
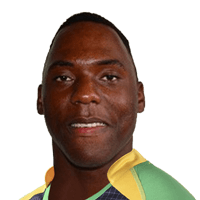 Odean Smith All-rounder |
4 | 11 | 1.3 | 9.00 | 19.80 | 13.2 | 5.8 | 34.8% | 0.0 | 3 |
22
 Bjorn Fortuin Bowler |
5 | 20 | 0.40 | 7.55 | 75.50 | 60.0 | 8.2 | 34.2% | 0.0 | 1 |
23
 Evan Jones All-rounder |
4 | 16.4 | 1.3 | 8.34 | 27.80 | 20.0 | 8.3 | 33.0% | 0.50 | 2 |
24
 Ottneil Baartman Bowler |
4 | 13.4 | 1.8 | 8.27 | 16.14 | 11.7 | 6.8 | 32.9% | 0.0 | 2 |
25
 Roelof van der Merwe All-rounder |
5 | 19.2 | 2.0 | 6.41 | 12.40 | 11.6 | 7.4 | 31.9% | 0.0 | 4 |
26
 Jason Holder All-rounder |
4 | 10.2 | 0.25 | 9.58 | 99.00 | 62.0 | 4.8 | 30.6% | 0.0 | 1 |
27
 James Neesham All-rounder |
5 | 11.4 | 0.20 | 8.83 | 103.00 | 70.0 | 3.6 | 25.7% | 0.0 | 1 |
28
 Tabraiz Shamsi Bowler |
3 | 11.2 | 1.0 | 6.97 | 26.33 | 22.7 | 5.7 | 25.0% | 0.0 | 2 |
29
 Andile Phehlukwayo All-rounder |
3 | 12.2 | 2.0 | 7.95 | 16.33 | 12.3 | 5.7 | 23.0% | 0.0 | 3 |
SA20 Stats Questions
SA20 2023 player and team stats: runs, averages and strike rates, wickets and economy, fielding and Dream11 points, and every side's batting, bowling and fielding. Statz tracks SA20 2023 across the points table, season leaderboards and venue scoring trends, updated after every completed match.
SA20 on Statz
Frequently asked questions
Who scored the most runs in the SA20 2023?
Faf du Plessis (Joburg Super Kings) with 369 runs in 10 matches, at a strike rate of 147.6.
Who took the most wickets in the SA20 2023?
Anrich Nortje (Pretoria Capitals) with 20 wickets at 5.95 an over.
Who hit the most sixes in the SA20 2023?
Will Jacks with 19 sixes.