How to use Statz Team Detail Page
Overview
Statz Team Detail Pages provide granular, player-by-player breakdowns of every key statistic for your selected team. While the Team Profile page shows team-level aggregates, Team Detail pages drill down into individual contributions — answering questions like “which Arsenal player commits the most fouls?” or “who takes the most shots on target for Liverpool?”
Whether you’re researching FPL differential picks, analysing tactical roles within a team, or building multi-leg bet builders around specific players, Team Detail pages give you the data-driven insights you need.
Where to Find Team Detail Pages
These pages are accessible from the Team Profile page via the left sidebar navigation. You can reach this by:
- Clicking any team badge or name or navigating via the search bar (as shown below) to go to the Team Profile page

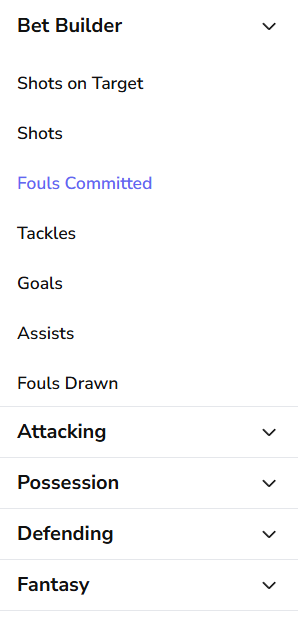
- Then clicking any statistic category in the Team Profile sidebar (e.g., “Fouls Committed”, “Shots on Target”, “Goals”). For this guide, we’ll use Arsenal’s Fouls Stats as our example: statz.ai/team/arsenal/fouls
Understanding the Page Layout
Next Fixture widget
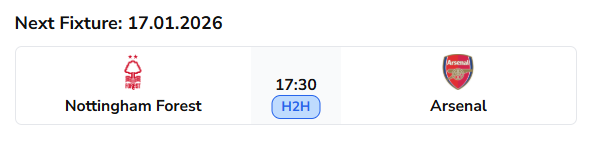
At the top of every Team Detail page, you’ll see the upcoming match for your selected team (in our example: Nottingham Forest vs Arsenal) with date and kick-off time. Click on the H2H button to be taken to the head-to-head page for this fixture (for a guide on H2H pages see here).
Filter Controls
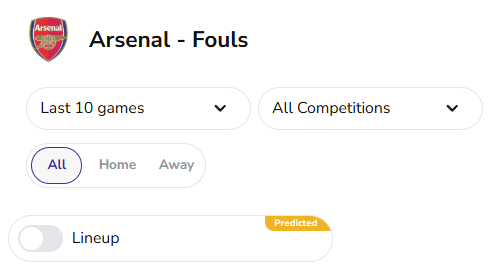
Team Detail pages offer the same three filtering options as Team Profile pages, allowing you to customize your analysis, however there is also an additional line-up toggle which we will touch on later. Below are the default filtering options: Last 10 Games, All Competitions, All Venues.
Game/Season Dropdown
Controls the sample size of matches displayed. Options include:
- Last 5 games
- Last 10 games (default in our example)
- Last 30 games
- Whole seasons (e.g. 2025/26)
How to use it: Adjust based on your research needs. Recent form (Last 5-10 games) helps identify players in current form, while season-long data reveals consistent performers across the campaign.
Competition Dropdown
This filter lets you narrow the data by competition, or keep it on “All Competitions” to see aggregate statistics across all tournaments.
How to use it: Filter to a specific competition or multiple competitions when fixture context matters. For example, if Arsenal have a Champions League fixture coming up, filtering to “UEFA Champions League” shows European player form, which often differs from domestic league performance.
Home / Away / All Toggle
Three buttons that filter by venue:
- All (default) — Statistics across all venues
- Home — Home fixture statistics only
- Away — Away fixture statistics only
Why this matters: Player performance can vary significantly by venue. A striker might score more at home due to crowd support and tactical confidence, while a defensive midfielder might commit more fouls away from home due to increased defensive pressure.
The Team Detail Table
Match Context
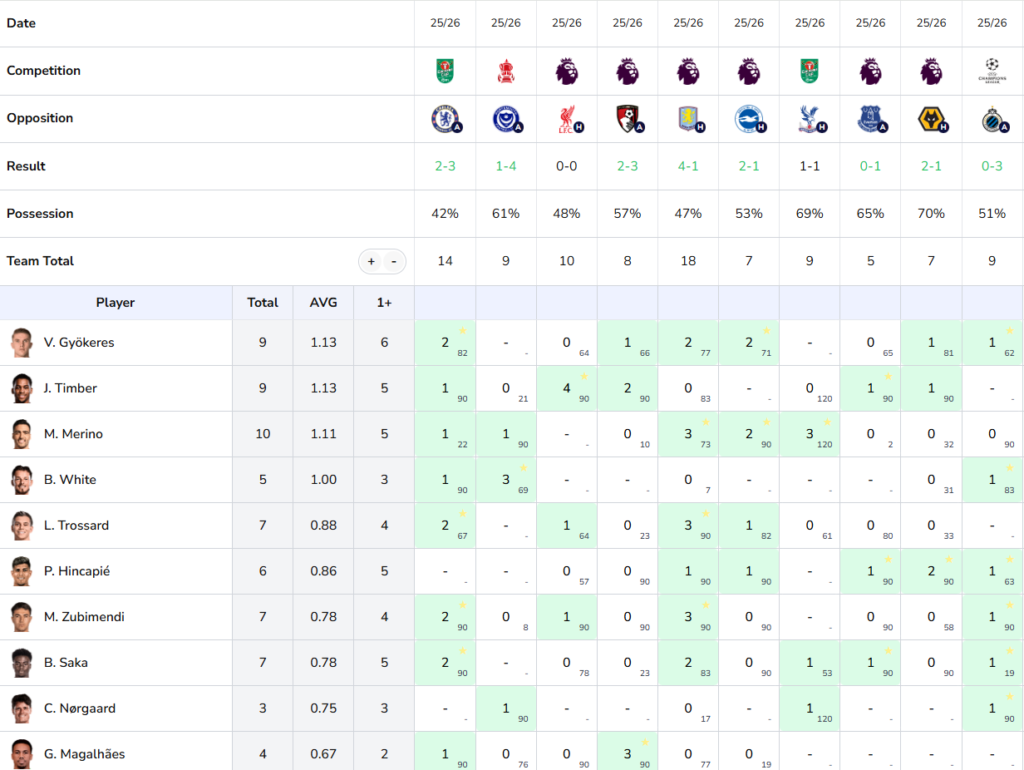
In the image below, we have the top of the Fouls Team Detail Table for Arsenal. All tables will start with match context rows, showing:
- Season
- Competition – The logos are clickable if you would like to see the associated competition hub (guide to comp hubs here)
- Opposition and Venue – Clickable opposition logos if you would like to see their team detail page. Also a small venue indicator.
- Result – Colour coded score of each match (Green = Win, Grey = Draw, Red = Loss)
- Possession – Useful context of game state
- Team Total – How much of your chosen statistic did the team get in this fixture (for example Arsenal committed 14 fouls against Chelsea in their most recent game)
Fixed Player Columns
On each Team Detail page the first four columns are fixed:
- Player – listed in descending order by AVG (explained below).
- Total – The total for that player across the filtered sample size.
- AVG – The player’s average per match across the filtered period. For each player, average only takes into account fixtures they played in. For example, Ben White totalled 5 fouls across the last 10 games but because he only featured in 5, his average is 1.00 (5 fouls ÷ 5 appearances).
- 1+ – The number of matches where the player recorded at least one instance of the statistic. This tells you consistency, a player with a high Total but low 1+ stat might have one or two huge performances, while a player with a high 1+ contributes regularly.
The + and – buttons: These adjust the 1+ column threshold. Click + to increase the threshold, or – to decrease it.
Player Statistics
To the right of the fixed columns, in the centre of each cell you’ll see player stat totals from each fixture, along with the number of minutes they played in the bottom right corner. For example, in Arsenal’s most recent fixture (3-2 vs Chelsea), Mikel Merino committed a foul even though he played just 22 minutes – crucial context when analysing these tables.
Green Highlights
The green highlighting indicates which players hit the threshold set by the +/- buttons in each fixture. By default, the page highlights cells that meet or exceed 1+ but if you click + the column header will change to 2+ and any cells with 1 in will no longer be highlighted.
The Gold Star
In some cells, you’ll notice a gold star icon (⭐) — this marks the top performer for that fixture in the selected statistic. If multiple players tie for the top performance, all will receive a star.
The Lineup Toggle
Just below the venue toggle buttons, you’ll see a “Lineup” toggle with a yellow “Predicted” badge. When enabled, the team detail page will update to only show players expected to start in the upcoming fixture. Also when the actual line-up is realised (usually an hour before a match), the toggle will change to show a green “Live” badge. If there is no predicted or live line-up this toggle will show as “Not Available”.
How to use it: Before Arsenal’s next match against Nottingham Forest, toggle on “Lineup” to see predicted starters. This helps you identify which of the 11 starters are likely to accumulate the statistic in the upcoming fixture.
Putting Team Detail Data Into Action
Example 1: Using the “Lineup” Toggle to Filter Search
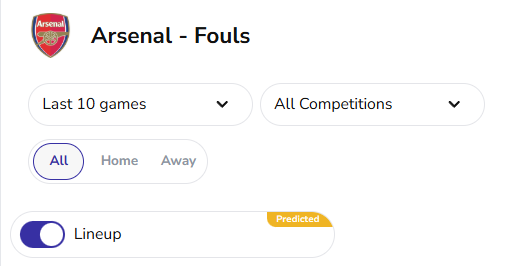
You’re building a multi-leg foul bet builder for Arsenal’s next fixture and want to include only players predicted to start with good fouling form over the last 10 games. Navigate to the Arsenal Foul Page and keep all default filters apart from switching on the lineup toggle. Below are the 10 outfield players predicted to start, as you can see from the previous example, players like Piero Hincapié and Christian Nørgaard have been removed, as they are not in the predicted 11.
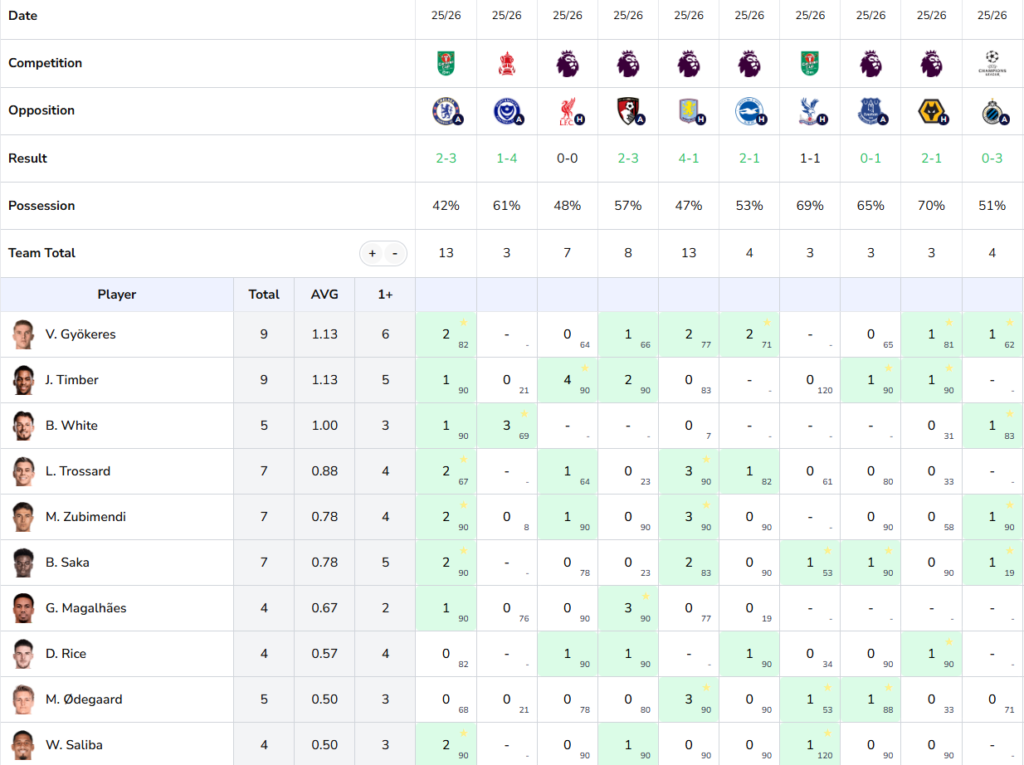
Standout Selections:
- Viktor Gyökeres: 9 Fouls in 8 games, hitting 1+ in 6 of 8 ✅
- Ben White: 5 fouls in his last 3 starts ✅
- Leandro Trossard: Hit 1+ in his last 4 starts: ✅
Example 2: Identifying Arsenal’s Least Disciplined Players This Season
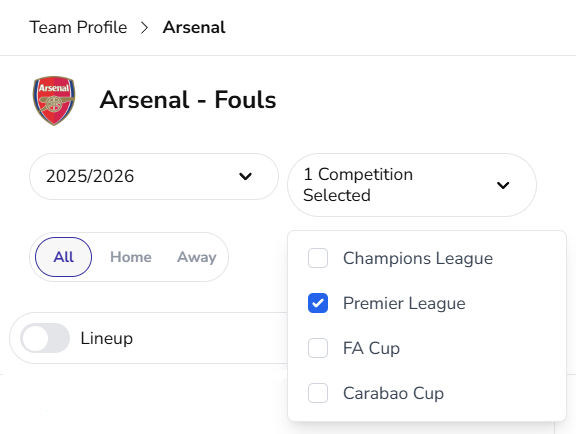
Step 1: Set Game/Season Dropdown to “2025/26” season
Step 2: Set Competition Dropdown to “Premier League“ only
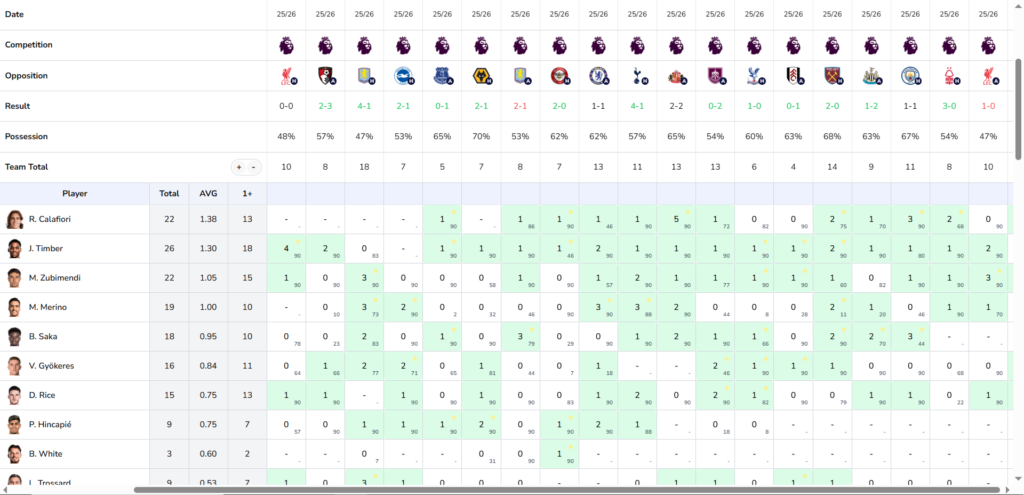
Shown in the image below, this is a lot of fixtures and therefore you may need to scroll across to see all games and scroll down to see all players.
From our data we can see that the top foulers are:
- Riccardo Calafiori: 22 fouls, 1.38 per game
- Jurriën Timber: 26 fouls, 1.30 per game
- Martín Zubimendi: 22 fouls, 1.05 per game
Cross-reference with Yellow Card page: Navigate to Arsenal’s Yellow Cards detail page to see if these fouls are translating into bookings.
Example 3: Using the +/- Buttons to Spot Outlier Performances
You want to identify which Arsenal players had unusually high foul counts in specific matches (perhaps due to a tactical battle or aggressive opponent).
Step 1: Click the + button next to “Team Total” repeatedly to increase the threshold
Step 2: Watch as only the highest values remain highlighted (3, 4, 5 fouls per match)
Step 3: Look at which players contributed most in those high-foul matches, for example against Aston Villa, as a team Arsenal committed 18 fouls, with Merino and Zubimendi fouling 6 times between them suggesting a fiesty midfield battle.
Example 4: Fantasy Football Decision Making
You want to assess which Arsenal players rack up the most defensive contribution points before adding a new player to your team.
Step 1: Visit Arsenal’s FPL Defensive Contributions page (under Fantasy Tab)
Step 2: See which players consistently hit the defensive contribution points shown by the green highlights. We have auto set the threshold to the actual FPL point threshold (10 for defenders, 12 for mids and forwards)
Best Practices
✅ Use the +/- buttons to focus on truly standout performances
✅ Cross-reference multiple Team Detail pages for complete player profiles (e.g., Goals + Shots + xG)
✅ Check the 1+ column to assess consistency vs explosive variance
✅ Filter by venue (Home/Away) and competition for context-specific analysis
✅ Use gold stars to identify the team’s most reliable contributors
❌ The “Predicted” lineup is helpful but not guaranteed — always check back for the confirmed lineup
❌ Don’t compare players without checking their minutes played – A player who played 90 minutes vs 20 minutes will have very different per-match averages
❌ Don’t forget to cross-reference with the opposition (check their Team Profile to understand the matchup)
Conclusion
Statz Team Detail pages transform team-level statistics into actionable, player-specific insights. By mastering the filters (sample size, competition, venue), understanding the table structure (Total, AVG, 1+, match-by-match cells), and using the visual tools (green highlighting via +/-, gold stars for top performers), you can quickly identify which players to target for FPL, bet builders, and tactical analysis.
Apply the same workflow to every statistic category (Goals, Assists, Shots, Tackles, Passes, and more) to build a comprehensive understanding of individual player roles within any team.
Visit statz.ai/team/[any-team-name]/[stat-category] to start exploring player-level statistics today.