





























Seattle Orcas Stats
Seattle Orcas MLC Economy Rate Stats
How many runs an over Seattle Orcas concede, and who bowls tightest, game by game
Updated 12 July 2026, after the San Francisco Unicorns game
| Player | Avg | Hit % | ||||||||||
|---|---|---|---|---|---|---|---|---|---|---|---|---|
| Seattle Orcas total | 8.86 | 10.21 | 8.95 | 5.60 | 6.60 | 6.70 | 9.76 | 8.51 | 9.80 | 10.80 | 11.95 | |
 O. BaartmanBowler, 9 bowled |
7.48 | 44%4/9 | 4.504-18-2 | 2.254-9-3 | 5.754-23-2 | 9.504-38-1 | 9.754-39-1 | 5.502-11-1 | 9.004-36-3 | 8.254-33-4 | 13.333-40-1 | |
|
A
A. SheikhAll-rounder, 6 bowled
|
7.58 | 67%4/6 | 6.003-18-1 | 7.002-14-1 | -DNB | 3.502-7-1 | -DNB | 18.001-18-0 | 8.002-16-1 | -DNB | 9.002-18-0 | |
 M. StoinisAll-rounder, 8 bowled |
7.60 | 63%5/8 | 12.004-48-0 | 11.504-46-5 | 4.754-19-1 | 3.504-14-3 | 7.004-28-3 | 7.254-29-2 | 6.673-20-1 | -DNB | 8.181.5-15-1 | |
 J. SinghAll-rounder, 10 bowled |
8.76 | 30%3/10 | 9.254-37-1 | 8.254-33-0 | 8.254-33-1 | 9.004-36-2 | 6.004-24-1 | 10.004-40-0 | 6.004-24-5 | 7.254-29-3 | 11.504-46-2 | 15.502-31-1 |
 H. SinghAll-rounder, 7 bowled |
9.33 | 29%2/7 | -DNB | 8.502-17-0 | 5.004-20-2 | 17.001-17-0 | 13.333-40-1 | 7.754-31-1 | 9.504-38-1 | 11.003-33-0 | ||
 C. GannonBowler, 10 bowled |
9.46 | 50%5/10 | 12.502-25-1 | 10.254-41-0 | 5.504-22-0 | 7.254-29-1 | 6.502-13-0 | 7.504-30-2 | 6.862.2-16-2 | 12.502-25-0 | 12.504-50-0 | 13.754-55-1 |
 D. ShanakaAll-rounder, 8 bowled |
10.57 | 38%3/8 | 13.002-26-0 | 6.504-26-4 | 5.502-11-0 | -DNB | 13.502.4-36-2 | 6.001-6-0 | 14.754-59-2 | 11.004-44-3 | 10.502.4-28-0 | |
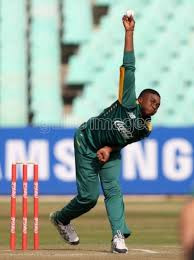 L. SipamlaBowler, 1 bowled |
10.67 | 0%0/1 | 10.673-32-1 | |||||||||
 T. SanghaBowler, 1 bowled |
11.00 | 0%0/1 | 11.003-33-0 |

Seattle Orcas Team Economy
Seattle Orcas Economy Match by Match
The last 10 MLC matches and how often Seattle Orcas kept under the line
| Opponent | Result | For | Ag | <9 |
|---|---|---|---|---|
| Avg | 8.89 | 8.98 | 50% | |
 San Francisco Unicorns (H)12 Jul |
Lby 6 wickets | 10.21 | 9.50 | |
 MI New York (A)10 Jul |
Lby 17 runs | 8.95 | 8.10 | |
 Texas Super Kings (H)5 Jul |
Wby 9 runs | 5.60 | 6.05 | |
| MI New York (H)3 Jul |
Lby 5 runs | 6.60 | 6.35 | |
 Los Angeles Knight Riders (A)28 Jun |
Wby 20 runs | 6.70 | 7.70 | |
| San Francisco Unicorns (A)27 Jun |
Lby 2 wickets | 9.76 | 9.88 | |
 Washington Freedom (A)26 Jun |
Wby 88 runs | 8.51 | 11.35 | |
| Los Angeles Knight Riders (H)21 Jun |
Lby 81 runs | 9.80 | 7.42 | |
| Washington Freedom (H)20 Jun |
Wby 5 wickets | 10.80 | 12.40 | |
| Texas Super Kings (A)19 Jun |
Lby 6 wickets | 11.95 | 11.00 |
Seattle Orcas Economy Lines
How often they kept under each line, last 10 MLC matches
| Line | Over | Under | Under % |
|---|---|---|---|
| 8 | 7 | 3 | 30% |
| 8.5 | 7 | 3 | 30% |
| 9 | 5 | 5 | 50% |
| 9.5 | 5 | 5 | 50% |
| 10 | 3 | 7 | 70% |
| Line | Over | Under | Under % |
|---|
Economy Batting First and Chasing
Seattle Orcas's economy rate per game by when they batted
| Batting | P | W | For | Ag |
|---|---|---|---|---|
| First | 6 | 3 | 8.79 | 9.25 |
| Second | 4 | 1 | 9.04 | 8.57 |
MLC 2026 Economy Table
Economy rate, this season
| Side | P | For | Ag |
|---|---|---|---|
| 1Los Angeles Knight Riders |
12 | 8.31 | 8.53 |
| 2Texas Super Kings |
10 | 8.51 | 8.28 |
| 3San Francisco Unicorns |
12 | 8.75 | 9.24 |
| 4MI New York |
11 | 8.76 | 8.41 |
| 5Seattle Orcas |
10 | 8.86 | 8.97 |
| 6Washington Freedom |
13 | 9.92 | 9.73 |
Seattle Orcas MLC Economy Questions
What is Seattle Orcas's economy rate in MLC matches?
Seattle Orcas's bowlers have conceded 8.86 runs an over in their last 10 MLC matches, and Seattle Orcas have scored at 8.97 against them.
How often do Seattle Orcas concede under 9 an over?
Seattle Orcas conceded under 9 an over in 5 of their last 10 MLC matches.
Who is Seattle Orcas's most economical bowler?
Over Seattle Orcas's last 10 MLC matches, bowling three times or more: Ottneil Baartman (7.48 in 9 spells), Ali Sheikh (7.58 in 6 spells), Marcus Stoinis (7.60 in 8 spells).