





























Delhi Capitals Stats
Delhi Capitals IPL Performance Points Stats
How many performance points Delhi Capitals score, and who scores the most, game by game
Updated 24 May 2026, after the Kolkata Knight Riders game
| Player | Avg | Hit % | |||||||||||||||||||||||||||||||
|---|---|---|---|---|---|---|---|---|---|---|---|---|---|---|---|---|---|---|---|---|---|---|---|---|---|---|---|---|---|---|---|---|---|
| Delhi Capitals total | 327 | 451 | 338 | 383 | 227 | 393 | 204 | 385 | 445 | 270 | 297 | 261 | 362 | 317 | 384 | 220 | 366 | 342 | 342 | 288 | 319 | 398 | 359 | 285 | 300 | 328 | 242 | 303 | 285 | 405 | 334 | 293 | |
 L. RahulKeeper, 13 played |
47.5 | 62%8/13 | 60 | 9 | 75 | 37 | 77 | 18 | 10 | 35 | 11 | 57 | 28 | 123 | 77 | ||||||||||||||||||
 S. ThakurBowler, 4 played |
45.3 | 50%2/4 | 54 | 83 | 20 | 24 | |||||||||||||||||||||||||||
 M. MarshAll-rounder, 10 played |
42.0 | 50%5/10 | 23 | 20 | 75 | 25 | 40 | 0 | 0 | 63 | 129 | 45 | |||||||||||||||||||||
 R. PantKeeper, 10 played |
40.1 | 70%7/10 | 27 | 86 | 61 | 1 | 38 | 53 | 49 | 42 | 13 | 31 | |||||||||||||||||||||
 A. PatelAll-rounder, 29 played |
38.5 | 59%17/29 | 79 | 66 | 30 | 22 | 66 | 21 | 20 | 34 | 39 | 25 | 31 | 77 | 55 | 20 | 0 | 68 | 35 | 21 | 40 | 71 | 27 | 74 | 41 | 2 | 46 | 19 | 67 | 0 | 21 | ||
 N. RanaBatter, 3 played |
38.3 | 67%2/3 | 33 | 67 | 15 | ||||||||||||||||||||||||||||
 R. RossouwBatter, 5 played |
35.8 | 60%3/5 | 82 | 35 | 18 | 14 | 30 | ||||||||||||||||||||||||||
 S. RizviBatter, 8 played |
34.5 | 50%4/8 | 10 | 51 | 2 | 6 | 70 | 68 | 49 | 20 | |||||||||||||||||||||||
 A. NortjeBowler, 11 played |
34.5 | 64%7/11 | 40 | 20 | 50 | 23 | 42 | 23 | 10 | 40 | 30 | 40 | 61 | ||||||||||||||||||||
 M. StarcBowler, 7 played |
33.1 | 43%3/7 | 60 | 40 | 70 | 20 | 12 | 10 | 20 | ||||||||||||||||||||||||
 T. StubbsKeeper, 20 played |
32.8 | 50%10/20 | 10 | 12 | 28 | 27 | 70 | 60 | 59 | 73 | 2 | 10 | 41 | 38 | 34 | 3 | 4 | 40 | 15 | 71 | 54 | 5 | |||||||||||
 D. WarnerBatter, 16 played |
30.8 | 44%7/16 | 1 | 18 | 10 | 49 | 39 | 46 | 20 | 2 | 21 | 29 | 65 | 66 | 15 | 10 | 62 | 39 | |||||||||||||||
 D. MillerBatter, 6 played |
29.7 | 50%3/6 | 48 | 61 | 0 | 42 | 17 | 10 | |||||||||||||||||||||||||
 L. NgidiBowler, 6 played |
28.8 | 50%3/6 | 60 | 0 | 0 | 50 | 3 | 60 | |||||||||||||||||||||||||
 M. TiwariAll-rounder, 3 played |
27.0 | 33%1/3 | 0 | 68 | 13 | ||||||||||||||||||||||||||||
 M. RahmanBowler, 3 played |
26.7 | 33%1/3 | 60 | 20 | 0 | ||||||||||||||||||||||||||||
 P. NissankaBatter, 5 played |
26.6 | 40%2/5 | 62 | 8 | 11 | 51 | 1 | ||||||||||||||||||||||||||
 P. ShawBatter, 9 played |
26.4 | 44%4/9 | 13 | 17 | 32 | 66 | 54 | 0 | 0 | 22 | 34 | ||||||||||||||||||||||
 K. NairBatter, 4 played |
26.3 | 50%2/4 | 5 | 44 | 15 | 41 | |||||||||||||||||||||||||||
 K. YadavBowler, 29 played |
26.1 | 41%12/29 | 60 | 0 | 1 | 40 | 4 | 60 | 40 | 27 | 0 | 24 | 40 | 20 | 36 | 45 | 0 | 60 | 20 | 41 | 0 | 20 | 20 | 34 | 47 | 23 | 26 | 21 | 42 | 0 | 5 | ||
 M. KumarBowler, 19 played |
26.0 | 32%6/19 | 20 | 0 | 20 | 0 | 20 | 20 | 50 | 90 | 20 | 20 | 30 | 43 | 60 | 20 | 20 | 0 | 0 | 61 | 0 | ||||||||||||
 L. YadavAll-rounder, 6 played |
25.2 | 50%3/6 | 3 | 42 | 34 | 38 | 24 | 10 | |||||||||||||||||||||||||
 I. SharmaBowler, 9 played |
24.6 | 56%5/9 | 20 | 40 | 30 | 0 | 30 | 40 | 0 | 40 | 21 | ||||||||||||||||||||||
 M. PandeyBatter, 5 played |
24.4 | 40%2/5 | 27 | 11 | 34 | 50 | 0 | ||||||||||||||||||||||||||
 J. Fraser-McGurkBatter, 7 played |
23.6 | 29%2/7 | 7 | 10 | 31 | 22 | 20 | 55 | 20 | ||||||||||||||||||||||||
 K. AhmedBowler, 15 played |
23.3 | 47%7/15 | 40 | 0 | 20 | 40 | 20 | 20 | 40 | 30 | 20 | 40 | 0 | 40 | 0 | 0 | 40 | ||||||||||||||||
 A. Hakim KhanBowler, 6 played |
23.2 | 17%1/6 | 10 | 12 | 61 | 24 | 28 | 4 | |||||||||||||||||||||||||
 V. NigamBowler, 7 played |
23.0 | 57%4/7 | 0 | 40 | 30 | 0 | 0 | 50 | 41 | ||||||||||||||||||||||||
 A. PorelKeeper, 15 played |
22.1 | 33%5/15 | 22 | 5 | 16 | 51 | 18 | 7 | 33 | 32 | 18 | 15 | 41 | 9 | 32 | 25 | 7 | ||||||||||||||||
 A. SharmaBatter, 9 played |
21.8 | 22%2/9 | 18 | 24 | 45 | 14 | 19 | 18 | 37 | 20 | 1 | ||||||||||||||||||||||
 S. HopeKeeper, 5 played |
21.6 | 40%2/5 | 39 | 6 | 19 | 11 | 33 | ||||||||||||||||||||||||||
 S. KhanBatter, 4 played |
19.0 | 25%1/4 | 10 | 24 | 10 | 32 | |||||||||||||||||||||||||||
 P. SaltKeeper, 4 played |
18.3 | 25%1/4 | 36 | 17 | 10 | 10 | |||||||||||||||||||||||||||
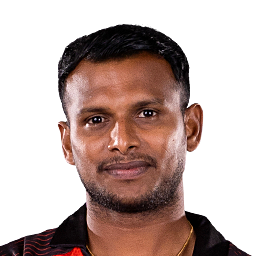 T. NatarajanBowler, 5 played |
18.2 | 20%1/5 | 20 | 0 | 10 | 1 | 60 | ||||||||||||||||||||||||||
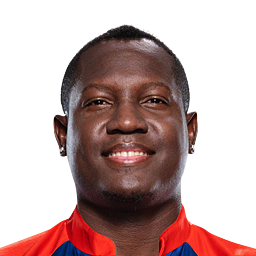 R. PowellBatter, 6 played |
15.2 | 17%1/6 | 22 | 1 | 43 | 12 | 10 | 3 | |||||||||||||||||||||||||
 F. du PlessisBatter, 3 played |
13.7 | 33%1/3 | 33 | 6 | 2 | ||||||||||||||||||||||||||||
 R. PatelBatter, 4 played |
13.5 | 0%0/4 | 20 | 23 | 5 | 6 | |||||||||||||||||||||||||||
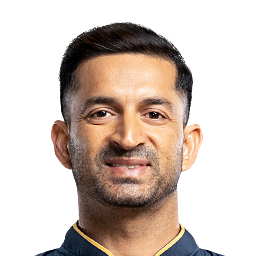 M. SharmaBowler, 4 played |
7.5 | 0%0/4 | 10 | 0 | 20 | 0 | |||||||||||||||||||||||||||
|
A
A. NabiBowler, 4 played
|
6.0 | 0%0/4 | 0 | 20 | 0 | 4 | |||||||||||||||||||||||||||
 K. KushagraKeeper, 3 played |
4.3 | 0%0/3 | 12 | 1 | 0 | ||||||||||||||||||||||||||||
 C. SakariyaBowler, 2 played |
42.0 | 100%2/2 | 44 | 40 | |||||||||||||||||||||||||||||
 R. Salam DarBowler, 2 played |
29.0 | 50%1/2 | 50 | 8 | |||||||||||||||||||||||||||||
 D. ChameeraBowler, 2 played |
24.0 | 0%0/2 | 28 | 20 | |||||||||||||||||||||||||||||
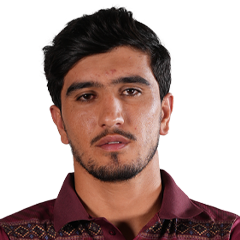 S. AtalBatter, 1 played |
22.0 | 0%0/1 | 22 | ||||||||||||||||||||||||||||||
 L. WilliamsBowler, 1 played |
21.0 | 0%0/1 | 21 | ||||||||||||||||||||||||||||||
 K. JamiesonBowler, 1 played |
20.0 | 0%0/1 | 20 | ||||||||||||||||||||||||||||||
|
S
S. ParakhBowler, 2 played
|
18.5 | 0%0/2 | 24 | 13 | |||||||||||||||||||||||||||||
 S. KumarAll-rounder, 2 played |
15.5 | 0%0/2 | 29 | 2 | |||||||||||||||||||||||||||||
 Y. DhullBatter, 2 played |
10.5 | 0%0/2 | 10 | 11 | |||||||||||||||||||||||||||||
 K. NagarkotiBowler, 2 played |
10.0 | 0%0/2 | 10 | 10 | |||||||||||||||||||||||||||||
 P. GargBatter, 1 played |
10.0 | 0%0/1 | 10 | ||||||||||||||||||||||||||||||
 S. BharatKeeper, 2 played |
4.0 | 0%0/2 | 0 | 8 | |||||||||||||||||||||||||||||
 J. RichardsonBowler, 1 played |
2.0 | 0%0/1 | 2 | ||||||||||||||||||||||||||||||
 R. BhuiBatter, 2 played |
1.50 | 0%0/2 | 0 | 3 | |||||||||||||||||||||||||||||
 D. FerreiraKeeper, 1 played |
1.00 | 0%0/1 | 1 | ||||||||||||||||||||||||||||||

Delhi Capitals Team Performance
Delhi Capitals Performance Match by Match
The last 31 IPL matches and how often Delhi Capitals went over the line
Delhi Capitals Performance Lines
How often each line went over, last 31 IPL matches
| Line | Over | Under | Over % |
|---|---|---|---|
| 280.5 | 25 | 6 | 81% |
| 300.5 | 19 | 12 | 61% |
| 320.5 | 16 | 15 | 52% |
| 340.5 | 13 | 18 | 42% |
| 360.5 | 10 | 21 | 32% |
| Line | Over | Under | Over % |
|---|---|---|---|
| 640.5 | 20 | 11 | 65% |
| 660.5 | 18 | 13 | 58% |
| 680.5 | 15 | 16 | 48% |
| 700.5 | 13 | 18 | 42% |
| 720.5 | 11 | 20 | 35% |
Performance Batting First and Chasing
Delhi Capitals's performance points per game by when they batted
| Batting | P | W | For | Ag |
|---|---|---|---|---|
| First | 10 | 6 | 324 | 349 |
| Second | 21 | 10 | 328 | 349 |
IPL 2026 Performance Table
Performance points per game, this season
| Side | P | For | Ag | Match |
|---|---|---|---|---|
1 Gujarat Titans |
17 | 374 | 328 | 702 |
2 Sunrisers Hyderabad |
15 | 372 | 377 | 750 |
3 Royal Challengers Bengaluru |
16 | 368 | 324 | 691 |
4 Rajasthan Royals |
16 | 360 | 352 | 712 |
5 Kolkata Knight Riders |
13 | 356 | 328 | 684 |
6 Punjab Kings |
13 | 342 | 356 | 698 |
7 Chennai Super Kings |
14 | 332 | 336 | 668 |
8 Mumbai Indians |
14 | 324 | 352 | 676 |
9 Lucknow Super Giants |
14 | 307 | 358 | 665 |
| 10Delhi Capitals |
14 | 305 | 345 | 650 |
Delhi Capitals IPL Performance Questions
How many performance points do Delhi Capitals score per IPL match?
Delhi Capitals have averaged 327 performance points per IPL match over their last 31 IPL matches, their opponents 349, and the match 676 between them.
How often do Delhi Capitals go over 320.5 performance points?
Delhi Capitals went over 320.5 performance points in 16 of their last 31 IPL matches.
Who scores the most performance points for Delhi Capitals?
Over Delhi Capitals's last 31 IPL matches: Axar Patel (1117 in 29, 38.5 a game), Kuldeep Yadav (756 in 29, 26.1 a game), Tristan Stubbs (656 in 20, 32.8 a game).
What is Delhi Capitals's highest performance points in a recent IPL match?
451 against Kolkata Knight Riders on 24 May 2026 at Eden Gardens, Kolkata.
Do Delhi Capitals score more performance points batting first or chasing?
Batting first Delhi Capitals average 324 performance points (10 IPL matches); batting second 328 (21).