






Pakistan Stats
Pakistan ODI Performance Points Stats
How many performance points Pakistan score, and who scores the most, game by game
Updated 4 June 2026, after the Australia game
| Player | Avg | Hit % | ||||||||||
|---|---|---|---|---|---|---|---|---|---|---|---|---|
| Pakistan total | 453 | 242 | 312 | 531 | 430 | 396 | 504 | 561 | 575 | 439 | 538 | |
 S. AyubBatter, 7 played |
66.3 | 43%3/7 | 20 | 23 | 35 | 141 | 35 | 139 | 71 | |||
 S. AfridiBowler, 5 played |
55.4 | 60%3/5 | 11 | 90 | 50 | 96 | 30 | |||||
 K. GhulamBatter, 4 played |
52.5 | 50%2/4 | 10 | 63 | 14 | 123 | ||||||
 M. RizwanKeeper, 10 played |
51.2 | 70%7/10 | 0 | 61 | 63 | 57 | 60 | 60 | 63 | 100 | 11 | 37 |
 S. AghaAll-rounder, 10 played |
50.3 | 70%7/10 | 40 | 9 | 53 | 11 | 19 | 68 | 48 | 53 | 162 | 40 |
 A. JavedBowler, 3 played |
50.0 | 67%2/3 | 81 | 28 | 41 | |||||||
 B. AzamBatter, 9 played |
44.8 | 56%5/9 | 9 | 0 | 67 | 60 | 11 | 98 | 52 | 83 | 23 | |
 N. ShahBowler, 8 played |
44.8 | 75%6/8 | 46 | 60 | 67 | 51 | 20 | 45 | 60 | 9 | ||
 S. MuqeemBowler, 4 played |
43.8 | 50%2/4 | 20 | 22 | 53 | 80 | ||||||
 F. AshrafAll-rounder, 3 played |
38.7 | 33%1/3 | 0 | 23 | 93 | |||||||
|
H
H. NawazBatter, 3 played
|
37.3 | 33%1/3 | 13 | 36 | 63 | |||||||
 A. AhmedBowler, 5 played |
36.8 | 80%4/5 | 40 | 20 | 44 | 40 | 40 | |||||
|
T
T. TahirAll-rounder, 5 played
|
28.8 | 20%1/5 | 43 | 13 | 11 | 38 | 39 | |||||
 H. TalatAll-rounder, 3 played |
27.7 | 33%1/3 | 11 | 31 | 41 | |||||||
 I. KhanAll-rounder, 4 played |
24.8 | 25%1/4 | 60 | 25 | 11 | 3 | ||||||
 H. RaufBowler, 5 played |
24.0 | 40%2/5 | 23 | 41 | 16 | 0 | 40 | |||||
 A. ShafiqueBatter, 10 played |
23.5 | 20%2/10 | 0 | 36 | 39 | 43 | 1 | 36 | 10 | 0 | 0 | 70 |
 M. Wasim JrAll-rounder, 3 played |
20.3 | 33%1/3 | 10 | 41 | 10 | |||||||
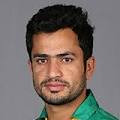 M. NawazAll-rounder, 2 played |
49.0 | 100%2/2 | 53 | 45 | ||||||||
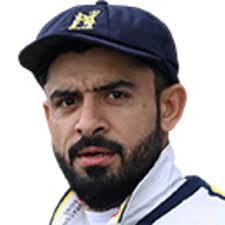 A. JamalAll-rounder, 1 played |
45.0 | 100%1/1 | 45 | |||||||||
|
F
F. AkramAll-rounder, 1 played
|
30.0 | 0%0/1 | 30 | |||||||||
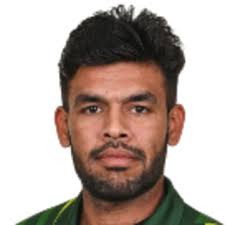 U. KhanKeeper, 2 played |
25.5 | 0%0/2 | 12 | 39 | ||||||||
 M. HasnainBowler, 1 played |
24.0 | 0%0/1 | 24 | |||||||||
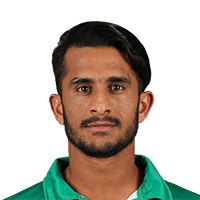 H. AliBowler, 2 played |
20.0 | 50%1/2 | 0 | 40 | ||||||||
|
M
M. AliBowler, 1 played
|
20.0 | 0%0/1 | 20 | |||||||||
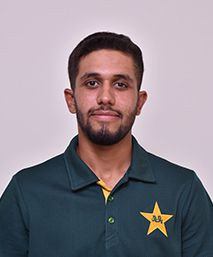 M. HarisKeeper, 1 played |
10.0 | 0%0/1 | 10 | |||||||||
 I. ul HaqBatter, 2 played |
2.0 | 0%0/2 | 1 | 3 | ||||||||

Pakistan Team Performance
Pakistan Performance Match by Match
The last 10 ODIs and how often Pakistan went over the line
| Opponent | Result | For | Ag | Total | 450.5+ |
|---|---|---|---|---|---|
| Avg | 453 | 480 | 933 | 50% | |
 West Indies (A)12 Aug 2025 |
Lby 202 runs | 242 | 533 | 775 | |
| West Indies (A)10 Aug 2025 |
Lby 5 wickets | 312 | 366 | 678 | |
| West Indies (A)8 Aug 2025 |
Wby 5 wickets | 531 | 401 | 932 | |
 New Zealand (A)4 Apr 2025 |
Lby 43 runs | 430 | 544 | 974 | |
| New Zealand (A)1 Apr 2025 |
Lby 84 runs | 396 | 560 | 956 | |
| New Zealand (A)28 Mar 2025 |
Lby 73 runs | 504 | 571 | 1075 | |
 South Africa (A)22 Dec 2024 |
Wby 36 runs | 561 | 530 | 1091 | |
| South Africa (A)19 Dec 2024 |
Wby 81 runs | 575 | 521 | 1096 | |
| South Africa (A)17 Dec 2024 |
Wby 3 wickets | 439 | 401 | 840 | |
 Zimbabwe (A)28 Nov 2024 |
Wby 99 runs | 538 | 373 | 911 |
England Performance Match by Match
Pakistan's next opponent, their last 10 ODIs
| Opponent | Result | For | Ag | Total |
|---|---|---|---|---|
| Avg | 490 | 435 | 925 | |
 Sri Lanka (H)27 Sep |
Wby 223 runs | 638 | 293 | 931 |
| Sri Lanka (H)24 Sep |
Lby 16 runs | 456 | 575 | 1031 |
| Sri Lanka (H)22 Sep |
Wby 89 runs | 516 | 367 | 883 |
 India (H)19 Jul |
Wby 27 runs | 541 | 440 | 981 |
| India (H)16 Jul |
Wby 4 wickets | 505 | 389 | 894 |
| India (H)14 Jul |
Lby 6 wickets | 320 | 546 | 866 |
| Sri Lanka (A)27 Jan |
Wby 53 runs | 623 | 392 | 1015 |
| Sri Lanka (A)24 Jan |
Wby 5 wickets | 511 | 322 | 833 |
| Sri Lanka (A)22 Jan |
Lby 19 runs | 397 | 551 | 948 |
| New Zealand (A)1 Nov 2025 |
Lby 2 wickets | 388 | 479 | 867 |
Pakistan Performance Lines
How often each line went over, last 10 ODIs
| Line | Over | Under | Over % |
|---|---|---|---|
| 400.5 | 7 | 3 | 70% |
| 425.5 | 7 | 3 | 70% |
| 450.5 | 5 | 5 | 50% |
| 475.5 | 5 | 5 | 50% |
| 500.5 | 5 | 5 | 50% |
| Line | Over | Under | Over % |
|---|---|---|---|
| 875.5 | 7 | 3 | 70% |
| 900.5 | 7 | 3 | 70% |
| 925.5 | 6 | 4 | 60% |
| 950.5 | 5 | 5 | 50% |
| 975.5 | 3 | 7 | 30% |
Performance Batting First and Chasing
Pakistan's performance points per game by when they batted
| Batting | P | W | For | Ag |
|---|---|---|---|---|
| First | 4 | 3 | 497 | 448 |
| Second | 6 | 2 | 424 | 502 |
ODI Performance Table
Performance points per game, sides with 8+ ODIs in the last two years
| Side | P | For | Ag | Match |
|---|---|---|---|---|
| 1India |
28 | 481 | 410 | 891 |
2 England |
24 | 463 | 457 | 920 |
| 3South Africa |
24 | 460 | 451 | 911 |
4 Afghanistan |
15 | 448 | 404 | 851 |
| 5New Zealand |
32 | 447 | 410 | 858 |
| 6Sri Lanka |
22 | 435 | 444 | 879 |
7 Australia |
22 | 430 | 453 | 883 |
| 8Pakistan |
26 | 419 | 419 | 838 |
9 Ireland |
14 | 414 | 461 | 875 |
10 Bangladesh |
27 | 412 | 424 | 836 |
| 11West Indies |
26 | 409 | 448 | 857 |
12 Namibia |
8 | 386 | 457 | 843 |
| 13Zimbabwe |
16 | 370 | 430 | 800 |
Pakistan ODI Performance Questions
How many performance points do Pakistan score per ODI?
Pakistan have averaged 453 performance points per ODI over their last 10 ODIs, their opponents 480, and the match 933 between them.
How often do Pakistan go over 450.5 performance points?
Pakistan went over 450.5 performance points in 5 of their last 10 ODIs.
Who scores the most performance points for Pakistan?
Over Pakistan's last 10 ODIs: Mohammad Rizwan (512 in 10, 51.2 a game), Salman Agha (503 in 10, 50.3 a game), Saim Ayub (464 in 7, 66.3 a game).
What is Pakistan's highest performance points in a recent ODI?
575 against South Africa on 19 Dec 2024 at SuperSport Park, Centurion.
Do Pakistan score more performance points batting first or chasing?
Batting first Pakistan average 497 performance points (4 ODIs); batting second 424 (6).