






Nepal Stats
Nepal ODI Performance Points Stats
How many performance points Nepal score, and who scores the most, game by game
Updated 12 February 2024, after the Canada game
| Player | Avg | Hit % | |||||||||||||
|---|---|---|---|---|---|---|---|---|---|---|---|---|---|---|---|
| Nepal total | 422 | 446 | 533 | 440 | 411 | 434 | 313 | 450 | 473 | 439 | 390 | 413 | 465 | 274 | |
 P. KhadkaAll-rounder, 3 played |
78.7 | 67%2/3 | 155 | 21 | 60 | ||||||||||
 S. LamichhaneBowler, 7 played |
63.3 | 71%5/7 | 44 | 20 | 120 | 80 | 20 | 104 | 55 | ||||||
 R. PaudelBatter, 10 played |
59.2 | 50%5/10 | 10 | 127 | 88 | 10 | 28 | 21 | 35 | 126 | 96 | 51 | |||
 S. KamiAll-rounder, 12 played |
53.1 | 67%8/12 | 39 | 57 | 30 | 86 | 23 | 63 | 58 | 31 | 42 | 46 | 112 | 50 | |
 A. SahAll-rounder, 4 played |
47.3 | 50%2/4 | 122 | 50 | 1 | 16 | |||||||||
 B. SharkiBatter, 5 played |
46.8 | 40%2/5 | 121 | 43 | 17 | 26 | 27 | ||||||||
 D. Singh AireeBatter, 8 played |
46.6 | 63%5/8 | 40 | 43 | 84 | 105 | 65 | 6 | 20 | 10 | |||||
|
D
D. KhanalBatter, 4 played
|
42.0 | 50%2/4 | 10 | 76 | 82 | 0 | |||||||||
 A. SheikhKeeper, 7 played |
40.3 | 43%3/7 | 65 | 8 | 118 | 16 | 32 | 3 | 40 | ||||||
 K. MallaAll-rounder, 5 played |
40.2 | 80%4/5 | 40 | 49 | 40 | 11 | 61 | ||||||||
 G. JhaBowler, 4 played |
39.0 | 75%3/4 | 40 | 57 | 59 | 0 | |||||||||
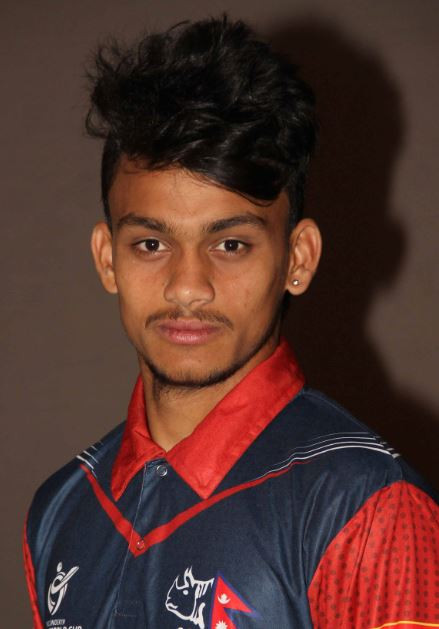 K. BhurtelBatter, 9 played |
35.1 | 44%4/9 | 23 | 62 | 50 | 55 | 16 | 10 | 42 | 23 | 35 | ||||
 A. SheikhBatter, 10 played |
30.3 | 30%3/10 | 10 | 48 | 10 | 43 | 34 | 34 | 29 | 21 | 49 | 25 | |||
 G. MallaAll-rounder, 8 played |
28.3 | 50%4/8 | 64 | 26 | 0 | 45 | 6 | 41 | 44 | 0 | |||||
 K. KCAll-rounder, 6 played |
27.7 | 50%3/6 | 20 | 3 | 42 | 40 | 18 | 43 | |||||||
 B. BhandariKeeper, 4 played |
25.5 | 0%0/4 | 27 | 39 | 21 | 15 | |||||||||
|
A
A. SaudBatter, 3 played
|
23.3 | 33%1/3 | 9 | 0 | 61 | ||||||||||
 L. RajbanshiBowler, 8 played |
22.8 | 25%2/8 | 20 | 51 | 30 | 60 | 6 | 10 | 3 | 2 | |||||
 P. SarrafBowler, 8 played |
21.0 | 25%2/8 | 0 | 44 | 35 | 50 | 27 | 0 | 8 | 4 | |||||
|
H
H. DhamiBowler, 1 played
|
60.0 | 100%1/1 | 60 | ||||||||||||
 K. Singh AireeBowler, 1 played |
58.0 | 100%1/1 | 58 | ||||||||||||
 R. Kumar PaudelBatter, 2 played |
40.5 | 50%1/2 | 16 | 65 | |||||||||||
 B. SobAll-rounder, 2 played |
30.5 | 50%1/2 | 21 | 40 | |||||||||||
|
A
A. ChandBowler, 2 played
|
25.0 | 0%0/2 | 30 | 20 | |||||||||||
 S. BhariBowler, 1 played |
20.0 | 0%0/1 | 20 | ||||||||||||
 S. JoraAll-rounder, 1 played |
19.0 | 0%0/1 | 19 | ||||||||||||
 S. TamangBowler, 2 played |
15.0 | 0%0/2 | 20 | 10 | |||||||||||
|
R
R. DhakalAll-rounder, 2 played
|
12.0 | 0%0/2 | 0 | 24 | |||||||||||
|
1 played
|
10.0 | 0%0/1 | 10 | ||||||||||||
|
H
H. ShahAll-rounder, 2 played
|
9.0 | 0%0/2 | 10 | 8 | |||||||||||
 S. VesawkarBatter, 1 played |
6.0 | 0%0/1 | 6 | ||||||||||||

Nepal Team Performance
Nepal Performance Match by Match
The last 13 ODIs and how often Nepal went over the line
| Opponent | Result | For | Ag | Total | 425.5+ |
|---|---|---|---|---|---|
| Avg | 422 | 379 | 801 | 62% | |
 Canada (H)12 Feb 2024 |
Wby 9 wickets | 446 | 238 | 684 | |
| Canada (H)10 Feb 2024 |
Wby 4 wickets | 533 | 435 | 968 | |
| Canada (H)8 Feb 2024 |
Wby 7 runs | 440 | 475 | 915 | |
 United Arab Emirates (H)18 Nov 2022 |
Wby 6 wickets | 411 | 226 | 637 | |
| United Arab Emirates (H)16 Nov 2022 |
Wby 3 wickets | 434 | 345 | 779 | |
| United Arab Emirates (H)14 Nov 2022 |
Lby 84 runs | 313 | 481 | 794 | |
 Papua New Guinea (H)26 Mar 2022 |
Lby 3 wickets | 450 | 450 | 900 | |
| Papua New Guinea (H)25 Mar 2022 |
Lby 6 runs | 473 | 502 | 975 | |
| Papua New Guinea (H)10 Sep 2021 |
Wby 151 runs | 439 | 318 | 757 | |
| Papua New Guinea (H)7 Sep 2021 |
Wby 2 wickets | 390 | 352 | 742 | |
| United Arab Emirates (A)28 Jan 2019 |
Wby 4 wickets | 413 | 406 | 819 | |
| United Arab Emirates (A)26 Jan 2019 |
Wby 145 runs | 465 | 331 | 796 | |
| United Arab Emirates (A)25 Jan 2019 |
Lby 3 wickets | 274 | 373 | 647 |
Nepal Performance Lines
How often each line went over, last 13 ODIs
| Line | Over | Under | Over % |
|---|---|---|---|
| 375.5 | 11 | 2 | 85% |
| 400.5 | 10 | 3 | 77% |
| 425.5 | 8 | 5 | 62% |
| 450.5 | 3 | 10 | 23% |
| 475.5 | 1 | 12 | 8% |
| Line | Over | Under | Over % |
|---|---|---|---|
| 750.5 | 9 | 4 | 69% |
| 775.5 | 8 | 5 | 62% |
| 800.5 | 5 | 8 | 38% |
| 825.5 | 4 | 9 | 31% |
| 850.5 | 4 | 9 | 31% |
Performance Batting First and Chasing
Nepal's performance points per game by when they batted
| Batting | P | W | For | Ag |
|---|---|---|---|---|
| First | 5 | 3 | 414 | 389 |
| Second | 8 | 6 | 427 | 373 |
ODI Performance Table
Performance points per game, sides with 8+ ODIs in the last two years
| Side | P | For | Ag | Match |
|---|---|---|---|---|
1 India |
28 | 481 | 410 | 891 |
2 England |
24 | 463 | 457 | 920 |
3 South Africa |
24 | 460 | 451 | 911 |
4 Afghanistan |
15 | 448 | 404 | 851 |
5 New Zealand |
32 | 447 | 410 | 858 |
6 Sri Lanka |
22 | 435 | 444 | 879 |
7 Australia |
22 | 430 | 453 | 883 |
8 Pakistan |
26 | 419 | 419 | 838 |
9 Ireland |
14 | 414 | 461 | 875 |
10 Bangladesh |
27 | 412 | 424 | 836 |
11 West Indies |
26 | 409 | 448 | 857 |
12 Namibia |
8 | 386 | 457 | 843 |
13 Zimbabwe |
16 | 370 | 430 | 800 |
Nepal ODI Performance Questions
How many performance points do Nepal score per ODI?
Nepal have averaged 422 performance points per ODI over their last 13 ODIs, their opponents 379, and the match 801 between them.
How often do Nepal go over 425.5 performance points?
Nepal went over 425.5 performance points in 8 of their last 13 ODIs.
Who scores the most performance points for Nepal?
Over Nepal's last 13 ODIs: Sompal Kami (637 in 12, 53.1 a game), Rohit Paudel (592 in 10, 59.2 a game), Sandeep Lamichhane (443 in 7, 63.3 a game).
What is Nepal's highest performance points in a recent ODI?
533 against Canada on 10 Feb 2024 at Tribhuvan University International Cricket Ground, Kirtipur.
Do Nepal score more performance points batting first or chasing?
Batting first Nepal average 414 performance points (5 ODIs); batting second 427 (8).