


Lineups confirmed — projections locked
· Ireland W batting first
Projections are locked to the confirmed XIs and toss — no need to switch scenario.
View revised Dream11 teams
England W vs Ireland W — England W won by 4 wickets (with 15 balls remaining)
ICC Women's T20 World Cup
•
Match 8th Match
Result


Statz Rating
A contextual performance score measuring each player's overall impact in the match. Scaled against the season so ratings are directly comparable across fixtures.
| Rank | Player | Rating |
|---|---|---|
| 1 |
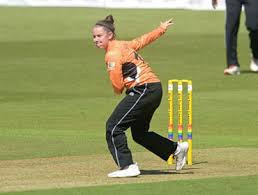
Orla Prendergast  IRE-W
IRE-W
|
132.8 |
| 2 |
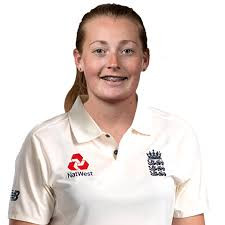
Charlie Dean  ENG-W
ENG-W
|
112.9 |
| 3 |
Aimee Maguire
IRE-W
|
70.2 |
| 4 |
Natalie Sciver-Brunt
ENG-W
|
66.1 |
| 5 |
Sophie Ecclestone
ENG-W
|
57.8 |
| 6 |
Louise Little
IRE-W
|
54.4 |
| 7 |
Danielle Gibson
ENG-W
|
43.7 |
| 8 |
Linsey Smith
ENG-W
|
39.8 |
| 9 |
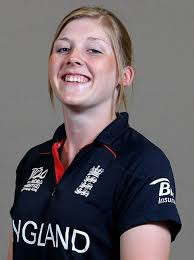
Heather Knight
ENG-W
|
36.6 |
| 10 |
Danni Wyatt-Hodge
ENG-W
|
23.0 |
| 11 |
Alana Dalzell
IRE-W
|
22.8 |
| 12 |
Lauren Bell
ENG-W
|
21.7 |
| 13 |
Alice Tector
IRE-W
|
16.7 |
| 14 |
Arlene Kelly
IRE-W
|
14.6 |
| 15 |
Amy Ellen Jones
ENG-W
|
14.2 |
| 16 |
Rebecca Stokell
IRE-W
|
10.5 |
| 17 |
Leah Paul
IRE-W
|
10.1 |
| 18 |
Freya Kemp
ENG-W
|
9.4 |
| 19 |
Cara Murray
IRE-W
|
9.3 |
| 20 |
Amy Hunter
IRE-W
|
9.3 |
| 21 |
Alice Capsey
ENG-W
|
6.2 |
| 22 |
Gaby Lewis
IRE-W
|
0.0 |
How Statz Rating works:
- Each player receives a contextual match impact score based on their all-round contribution — batting, bowling, and situational factors.
- Ratings are scaled against the season benchmark so they are directly comparable across fixtures and to the season leaderboard.
- A typical top performer scores around 100. Exceptional performances can exceed 100.