







India vs South Africa Scorecard · T20 World Cup 2009


































Statz Rating
A contextual performance score measuring each player's overall impact in the match. Scaled against the season so ratings are directly comparable across fixtures.
| Rank | Player | Rating |
|---|---|---|
| 1 |

Johan Botha
SA
|
116.5 |
| 2 |

Ravindra Jadeja
IND
|
79.5 |
| 3 |

AB de Villiers
SA
|
75.0 |
| 4 |

Harbhajan Singh
IND
|
69.4 |
| 5 |

Roelof van der Merwe
SA
|
49.8 |
| 6 |

Rohit Sharma
IND
|
47.8 |
| 7 |

Yuvraj Singh
IND
|
46.9 |
| 8 |

Gautam Gambhir
IND
|
36.3 |
| 9 |

Jean-Paul Duminy
SA
|
35.3 |
| 10 |

Graeme Smith
SA
|
31.9 |
| 11 |

Dale Steyn
SA
|
27.3 |
| 12 |

Zaheer Khan
IND
|
25.8 |
| 13 |

RP Singh
IND
|
17.4 |
| 14 |

Suresh Raina
IND
|
15.9 |
| 15 |

Albie Morkel
SA
|
14.8 |
| 16 |

Mark Boucher
SA
|
12.7 |
| 17 |

Morne Morkel
SA
|
10.6 |
| 18 |
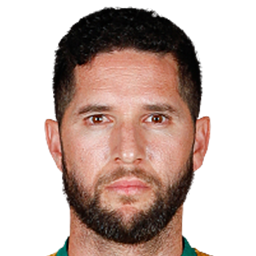
Wayne Parnell
SA
|
7.2 |
| 19 |

Herschelle Gibbs
SA
|
6.6 |
| 20 |
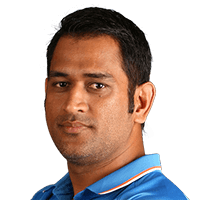
Mahendra Singh Dhoni
IND
|
6.1 |
| 21 |
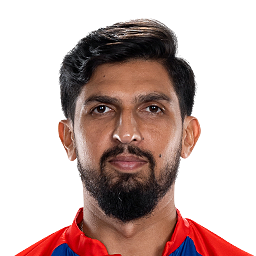
Ishant Sharma
IND
|
4.1 |
| 22 |

Yusuf Pathan
IND
|
0.0 |
How Statz Rating works:
- Each player receives a contextual match impact score based on their all-round contribution — batting, bowling, and situational factors.
- Ratings are scaled against the season benchmark so they are directly comparable across fixtures and to the season leaderboard.
- A typical top performer scores around 100. Exceptional performances can exceed 100.
India vs South Africa: result and key facts
South Africa won by 12 runs in T20 World Cup 2009 at Trent Bridge on 16 June 2009. AB de Villiers top-scored with 63 off 51 balls and Johan Botha took 3/16.
Frequently asked questions
Who won India vs South Africa?
South Africa won by 12 runs.
When and where was India vs South Africa played?
India vs South Africa was played at Trent Bridge, Nottingham on Tuesday 16 June 2009, in T20 World Cup 2009.
What were the final scores in India vs South Africa?
India scored 118/8 in 20 overs. South Africa scored 130/5 in 20 overs.
Who was the Statz MVP in India vs South Africa?
Johan Botha was named Statz MVP, earning a Statz Rating of 116/100. The Statz Rating combines batting impact, bowling impact and match context.
Who was the top run-scorer in India vs South Africa?
AB de Villiers top-scored with 63 off 51 balls.
Who took the most wickets in India vs South Africa?
Johan Botha took 3/16 in 4 overs.
Who played in India vs South Africa?
India XI: Gautam Gambhir, Rohit Sharma, Suresh Raina, Yuvraj Singh, Mahendra Singh Dhoni (c) (wk), Yusuf Pathan, Harbhajan Singh, Ravindra Jadeja, Zaheer Khan, RP Singh, Ishant Sharma. South Africa XI: Graeme Smith (c), Herschelle Gibbs, AB de Villiers, Jean-Paul Duminy, Mark Boucher (wk), Albie Morkel, Johan Botha, Roelof van der Merwe, Wayne Parnell, Dale Steyn, Morne Morkel.