






T20 Cricket World Cup 2026
InternationalT20 Cricket World Cup Player Bowling Average 2026
Every player ranked on bowling averages. Sorted on at least 10 overs.
Updated 8 March 2026, after New Zealand vs India
| #Player | M | Overs | Wkts | Econ | Avg | SR | Dots | Dot % | Mdns | Best |
|---|---|---|---|---|---|---|---|---|---|---|
1
  Azmatullah Omarzai All-rounder |
4 | 14.2 | 9 | 7.95 | 12.67 | 9.6 | 36 | 41.9% | 0 | 4 |
2
  Michael Leask All-rounder |
4 | 16.1 | 9 | 7.55 | 13.56 | 10.8 | 34 | 35.1% | 0 | 4 |
3
  Jasprit Bumrah Bowler |
6 | 20.4 | 9 | 6.10 | 14.00 | 13.8 | 56 | 45.2% | 0 | 3 |
4
  Adam Zampa Bowler |
4 | 15.2 | 8 | 7.57 | 14.50 | 11.5 | 34 | 37.0% | 0 | 4 |
5
  Rachin Ravindra All-rounder |
4 | 10.3 | 6 | 8.29 | 14.50 | 10.5 | 23 | 36.5% | 0 | 4 |
6
 Varun Chakaravarthy Bowler |
7 | 24.4 | 12 | 7.46 | 15.33 | 12.3 | 55 | 37.2% | 0 | 3 |
7
  Jamie Overton Bowler |
5 | 16.3 | 8 | 7.64 | 15.75 | 12.4 | 46 | 46.5% | 1 | 3 |
8
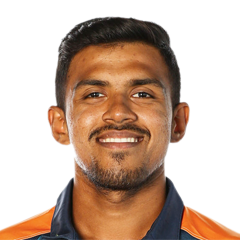  Maheesh Theekshana Bowler |
3 | 11.3 | 5 | 7.04 | 16.20 | 13.8 | 31 | 44.9% | 0 | 3 |
9
 Rashid Khan Bowler |
4 | 16.1 | 6 | 6.62 | 17.83 | 16.2 | 41 | 42.3% | 0 | 2 |
10
 Nathan Ellis Bowler |
4 | 13.3 | 5 | 6.81 | 18.40 | 16.2 | 34 | 42.0% | 0 | 4 |
11
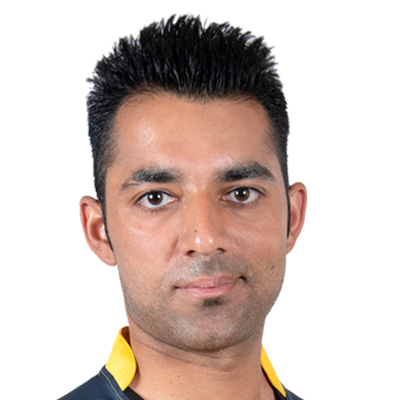  Saad Bin Zafar Bowler |
3 | 10.2 | 4 | 7.84 | 20.25 | 15.5 | 22 | 35.5% | 0 | 3 |
12
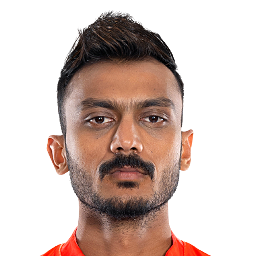 Axar Patel All-rounder |
5 | 19.2 | 7 | 7.40 | 20.43 | 16.6 | 50 | 43.1% | 1 | 2 |
13
 Arshdeep Singh Bowler |
6 | 23.2 | 8 | 7.33 | 21.38 | 17.5 | 57 | 40.7% | 0 | 3 |
14
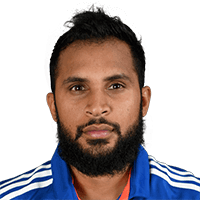 Adil Rashid Bowler |
7 | 27.3 | 10 | 7.78 | 21.40 | 16.5 | 66 | 40.0% | 0 | 2 |
15
 Will Jacks Batter |
7 | 20.3 | 9 | 9.51 | 21.67 | 13.7 | 45 | 36.6% | 0 | 3 |
16
 Liam Dawson Bowler |
7 | 23.5 | 8 | 7.34 | 21.88 | 17.9 | 49 | 34.3% | 0 | 3 |
17
 Bradley Currie Bowler |
4 | 13.4 | 4 | 6.51 | 22.25 | 20.5 | 36 | 43.9% | 0 | 2 |
18
 Mujeeb Ur Rahman Bowler |
4 | 15.1 | 5 | 7.58 | 23.00 | 18.2 | 41 | 45.1% | 0 | 2 |
19
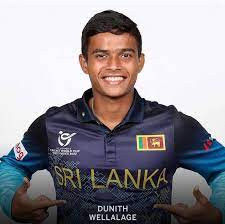 Dunith Wellalage Bowler |
3 | 12.1 | 3 | 5.92 | 24.00 | 24.3 | 27 | 37.0% | 0 | 1 |
20
 Shivam Dube All-rounder |
7 | 11.4 | 5 | 10.63 | 24.80 | 14.0 | 18 | 25.7% | 0 | 2 |
21
 Matt Henry Bowler |
4 | 14.4 | 5 | 8.66 | 25.40 | 17.6 | 34 | 38.6% | 1 | 2 |
22
 Jofra Archer Bowler |
7 | 27.3 | 9 | 9.53 | 29.11 | 18.3 | 72 | 43.6% | 1 | 2 |
23
 Sam Curran All-rounder |
7 | 19.1 | 5 | 8.97 | 34.40 | 23.0 | 32 | 27.8% | 0 | 3 |
24
 Oliver Davidson All-rounder |
4 | 12.2 | 3 | 8.51 | 35.00 | 24.7 | 18 | 24.3% | 0 | 1 |
25
 Hardik Pandya All-rounder |
7 | 26.1 | 6 | 8.29 | 36.17 | 26.2 | 60 | 38.2% | 1 | 2 |
26
 Mitchell Santner All-rounder |
4 | 16.2 | 2 | 6.61 | 54.00 | 49.0 | 28 | 28.6% | 0 | 1 |
27
 Lockie Ferguson Bowler |
4 | 11.2 | 2 | 10.41 | 59.00 | 34.0 | 20 | 29.4% | 0 | 1 |
28
 Mark Watt Bowler |
4 | 14.1 | 2 | 9.88 | 70.00 | 42.5 | 25 | 29.4% | 0 | 2 |
29
  Bernard Scholtz Bowler |
3 | 12.1 | 1 | 7.81 | 95.00 | 73.0 | 20 | 27.4% | 0 | 1 |
30
 Ruben Trumpelmann Bowler |
3 | 13 | 1 | 9.08 | 118.00 | 78.0 | 23 | 29.5% | 0 | 1 |
31
 Jaskaran Singh Buttar Bowler |
3 | 11.2 | 1 | 11.29 | 128.00 | 68.0 | 21 | 30.9% | 0 | 1 |
32
 Ziaur Rahman Sharifi Batter |
3 | 11 | 0 | 9.09 | - | - | 19 | 28.8% | 0 | 0 |
T20 Cricket World Cup Stats Questions
T20 Cricket World Cup 2026 player and team stats: runs, averages and strike rates, wickets and economy, fielding and Dream11 points, and every side's batting, bowling and fielding. Statz tracks T20 Cricket World Cup 2026 across the points table, season leaderboards and venue scoring trends, updated after every completed match.
T20 Cricket World Cup on Statz
Frequently asked questions
Who scored the most runs in the T20 Cricket World Cup 2026?
Sahibzada Farhan (Pakistan) with 383 runs in 6 matches, at a strike rate of 160.3.
Who took the most wickets in the T20 Cricket World Cup 2026?
Jasprit Bumrah (India) with 14 wickets at 6.00 an over.
Who hit the most sixes in the T20 Cricket World Cup 2026?
Sanju Samson with 24 sixes.