





New Zealand vs South Africa Player Ratings · One Day Internationals 2017
Statz Rating
A contextual performance score measuring each player's overall impact in the match. Scaled against the season so ratings are directly comparable across fixtures.
| Rank | Player | Rating |
|---|---|---|
| 1 |

Dwaine Pretorius
SA
|
156.5 |
| 2 |

Trent Boult
NZ
|
79.5 |
| 3 |

Mitchell Santner
NZ
|
67.4 |
| 4 |

James Neesham
NZ
|
65.2 |
| 5 |

Colin de Grandhomme
NZ
|
60.3 |
| 6 |

Ross Taylor
NZ
|
52.6 |
| 7 |

Kane Williamson
NZ
|
47.5 |
| 8 |

Imran Tahir
SA
|
40.4 |
| 9 |

Tim Southee
NZ
|
39.7 |
| 10 |
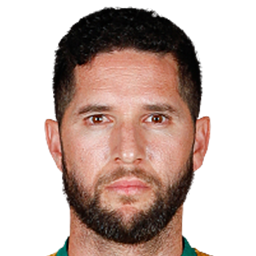
Wayne Parnell
SA
|
36.0 |
| 11 |

Quinton de Kock
SA
|
34.4 |
| 12 |

Andile Phehlukwayo
SA
|
31.9 |
| 13 |

AB de Villiers
SA
|
31.4 |
| 14 |

Ish Sodhi
NZ
|
30.3 |
| 15 |

Jean-Paul Duminy
SA
|
28.2 |
| 16 |

Chris Morris
SA
|
20.7 |
| 17 |

Dean Brownlie
NZ
|
20.5 |
| 18 |

David Miller
SA
|
17.0 |
| 19 |

Hashim Amla
SA
|
10.3 |
| 20 |

Faf du Plessis
SA
|
8.6 |
| 21 |

Neil Broom
NZ
|
1.7 |
| 22 |

Tom Latham
NZ
|
1.5 |
How Statz Rating works:
- Each player receives a contextual match impact score based on their all-round contribution — batting, bowling, and situational factors.
- Ratings are scaled against the season benchmark so they are directly comparable across fixtures and to the season leaderboard.
- A typical top performer scores around 100. Exceptional performances can exceed 100.

New Zealand vs South Africa: result and key facts
New Zealand won by 6 runs in One Day Internationals 2017 at Hagley Oval on 21 February 2017. Ross Taylor top-scored with 102 off 110 balls and Trent Boult took 3/63.
Frequently asked questions
Who won New Zealand vs South Africa?
New Zealand won by 6 runs.
When and where was New Zealand vs South Africa played?
New Zealand vs South Africa was played at Hagley Oval, Christchurch on Tuesday 21 February 2017, in One Day Internationals 2017.
What were the final scores in New Zealand vs South Africa?
New Zealand scored 289/4 in 50 overs. South Africa scored 283/9 in 50 overs.
Who was the Statz MVP in New Zealand vs South Africa?
Dwaine Pretorius was named Statz MVP, earning a Statz Rating of 157/100. The Statz Rating combines batting impact, bowling impact and match context.
Who was the top run-scorer in New Zealand vs South Africa?
Ross Taylor top-scored with 102 off 110 balls.
Who took the most wickets in New Zealand vs South Africa?
Trent Boult took 3/63 in 10 overs.
Who played in New Zealand vs South Africa?
New Zealand XI: Dean Brownlie, Tom Latham (wk), Kane Williamson (c), Ross Taylor, Neil Broom, James Neesham, Mitchell Santner, Colin de Grandhomme, Ish Sodhi, Tim Southee, Trent Boult. South Africa XI: Hashim Amla, Quinton de Kock (wk), Faf du Plessis, Jean-Paul Duminy, AB de Villiers (c), David Miller, Dwaine Pretorius, Chris Morris, Wayne Parnell, Andile Phehlukwayo, Imran Tahir.