





United States of America vs Canada Player Ratings · Tri-Nation Series 2024
Statz Rating
A contextual performance score measuring each player's overall impact in the match. Scaled against the season so ratings are directly comparable across fixtures.
| Rank | Player | Rating |
|---|---|---|
| 1 |

Saad Bin Zafar
CAN
|
107.1 |
| 2 |

Saiteja Mukkamalla
USA
|
83.6 |
| 3 |

Dillon Heyliger
CAN
|
78.8 |
| 4 |

Shadley van Schalkwyk
USA
|
77.8 |
| 5 |

Aaron Jones
USA
|
77.3 |
| 6 |

Nosthush Kenjige
USA
|
73.7 |
| 7 |
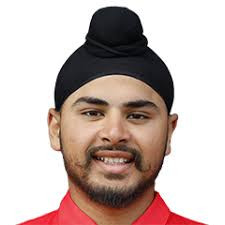
Dilpreet Singh Bajwa
CAN
|
68.5 |
| 8 |

Harmeet Singh
USA
|
58.4 |
| 9 |

Shreyas Movva
CAN
|
45.4 |
| 10 |
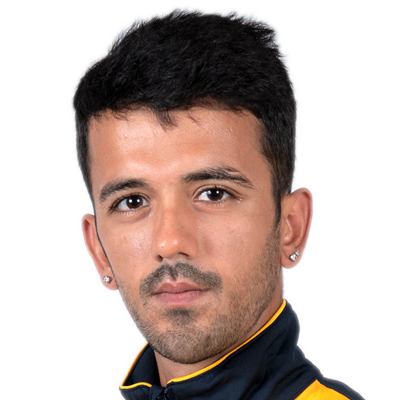
Shayan Jahangir
USA
|
37.6 |
| 11 |

Kaleem Sana
CAN
|
33.1 |
| 12 |

Nitish Kumar
USA
|
20.7 |
| 13 |

Harsh Thaker
CAN
|
20.4 |
| 14 |

Akhil Kumar
CAN
|
18.5 |
| 15 |

Andries Gous
USA
|
18.4 |
| 16 |

Monank Patel
USA
|
16.4 |
| 17 |
Parveen Kumar
CAN
|
15.5 |
| 18 |
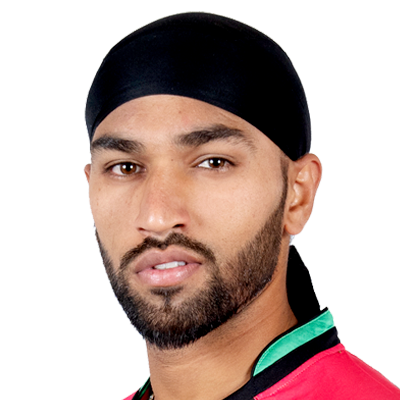
Jasdeep Singh
USA
|
6.9 |
| 19 |
Juanoy Drysdale
USA
|
6.3 |
| 20 |
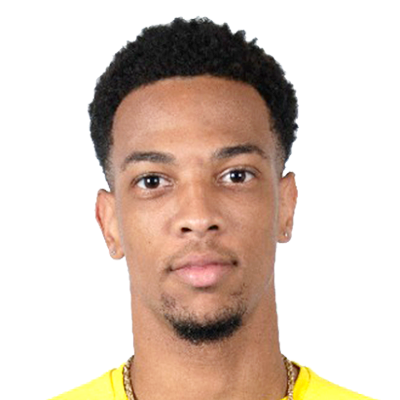
Nicholas Kirton
CAN
|
4.0 |
| 21 |

Kanwarpal Tathgur
CAN
|
3.3 |
| 22 |
Aaron Johnson
CAN
|
0.0 |
How Statz Rating works:
- Each player receives a contextual match impact score based on their all-round contribution — batting, bowling, and situational factors.
- Ratings are scaled against the season benchmark so they are directly comparable across fixtures and to the season leaderboard.
- A typical top performer scores around 100. Exceptional performances can exceed 100.

United States of America vs Canada: result and key facts
United States of America won by 20 runs in Tri-Nation Series 2024 at Sportpark Maarschalkerweerd on 27 August 2024. Dilpreet Singh Bajwa top-scored with 56 off 41 balls and Saad Bin Zafar took 3/25.
Frequently asked questions
Who won United States of America vs Canada?
United States of America won by 20 runs.
When and where was United States of America vs Canada played?
United States of America vs Canada was played at Sportpark Maarschalkerweerd, Utrecht on Tuesday 27 August 2024, in Tri-Nation Series 2024.
What were the final scores in United States of America vs Canada?
United States of America scored 168/6 in 20 overs. Canada scored 148/7 in 20 overs.
Who was the Statz MVP in United States of America vs Canada?
Saad Bin Zafar was named Statz MVP, earning a Statz Rating of 107/100. The Statz Rating combines batting impact, bowling impact and match context.
Who was the top run-scorer in United States of America vs Canada?
Dilpreet Singh Bajwa top-scored with 56 off 41 balls.
Who took the most wickets in United States of America vs Canada?
Saad Bin Zafar took 3/25 in 4 overs.
Who played in United States of America vs Canada?
United States of America XI: Monank Patel (c) (wk), Saiteja Mukkamalla, Andries Gous, Aaron Jones, Harmeet Singh, Nitish Kumar, Shayan Jahangir, Shadley van Schalkwyk, Nosthush Kenjige, Jasdeep Singh, Juanoy Drysdale. Canada XI: Aaron Johnson, Kanwarpal Tathgur, Dilpreet Singh Bajwa, Nicholas Kirton (c), Shreyas Movva (wk), Harsh Thaker, Dillon Heyliger, Akhil Kumar, Saad Bin Zafar, Kaleem Sana, Parveen Kumar.