







Sri Lanka vs Australia Scorecard · ICC Cricket World Cup Super League 2022







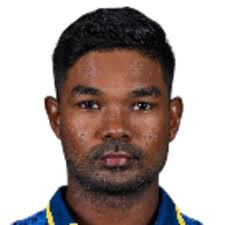
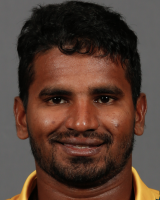














Statz Rating
A contextual performance score measuring each player's overall impact in the match. Scaled against the season so ratings are directly comparable across fixtures.
| Rank | Player | Rating |
|---|---|---|
| 1 |

Wanindu Hasaranga
SL
|
145.9 |
| 2 |

Ashton Agar
AUS
|
83.0 |
| 3 |

Glenn Maxwell
AUS
|
82.1 |
| 4 |

Marcus Stoinis
AUS
|
50.6 |
| 5 |

Kusal Mendis
SL
|
47.2 |
| 6 |
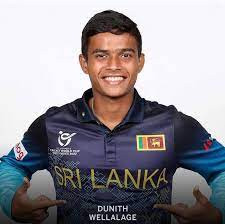
Dunith Wellalage
SL
|
45.0 |
| 7 |

Marnus Labuschagne
AUS
|
42.2 |
| 8 |

Maheesh Theekshana
SL
|
37.7 |
| 9 |

Danushka Gunathilaka
SL
|
37.6 |
| 10 |

Aaron Finch
AUS
|
32.1 |
| 11 |

Josh Hazlewood
AUS
|
31.9 |
| 12 |

Dasun Shanaka
SL
|
28.3 |
| 13 |

Pathum Nissanka
SL
|
28.2 |
| 14 |

Steven Smith
AUS
|
28.1 |
| 15 |

Jhye Richardson
AUS
|
25.3 |
| 16 |
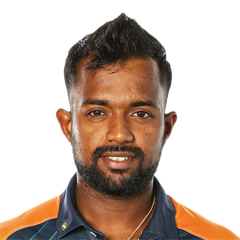
Charith Asalanka
SL
|
23.7 |
| 17 |

Chamika Karunaratne
SL
|
20.3 |
| 18 |

Alex Carey
AUS
|
17.6 |
| 19 |
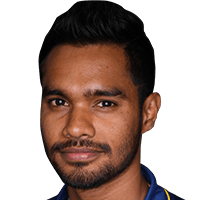
Dhananjaya de Silva
SL
|
14.5 |
| 20 |

Pat Cummins
AUS
|
11.0 |
| 21 |

Dushmantha Chameera
SL
|
7.9 |
| 22 |

David Warner
AUS
|
0.0 |
How Statz Rating works:
- Each player receives a contextual match impact score based on their all-round contribution — batting, bowling, and situational factors.
- Ratings are scaled against the season benchmark so they are directly comparable across fixtures and to the season leaderboard.
- A typical top performer scores around 100. Exceptional performances can exceed 100.
Sri Lanka vs Australia: result and key facts
Australia won by 2 wickets (with 9 balls remaining) (D/L method) in ICC Cricket World Cup Super League 2022 at Pallekele International Cricket Stadium on 14 June 2022. Kusal Mendis top-scored with 86 off 87 balls and Wanindu Hasaranga took 4/58.
Frequently asked questions
Who won Sri Lanka vs Australia?
Australia won by 2 wickets (with 9 balls remaining) (D/L method).
When and where was Sri Lanka vs Australia played?
Sri Lanka vs Australia was played at Pallekele International Cricket Stadium, Pallekele, Kandy on Tuesday 14 June 2022, in ICC Cricket World Cup Super League 2022.
What were the final scores in Sri Lanka vs Australia?
Sri Lanka scored 300/7 in 50 overs. Australia scored 282/8 in 42.3 overs.
Who was the Statz MVP in Sri Lanka vs Australia?
Wanindu Hasaranga was named Statz MVP, earning a Statz Rating of 146/100. The Statz Rating combines batting impact, bowling impact and match context.
Who was the top run-scorer in Sri Lanka vs Australia?
Kusal Mendis top-scored with 86 off 87 balls.
Who took the most wickets in Sri Lanka vs Australia?
Wanindu Hasaranga took 4/58 in 9 overs.
Who played in Sri Lanka vs Australia?
Sri Lanka XI: Danushka Gunathilaka, Pathum Nissanka, Kusal Mendis (wk), Dhananjaya de Silva, Charith Asalanka, Dasun Shanaka (c), Chamika Karunaratne, Wanindu Hasaranga, Dushmantha Chameera, Dunith Wellalage, Maheesh Theekshana. Australia XI: David Warner, Aaron Finch (c), Steven Smith, Marnus Labuschagne, Marcus Stoinis, Alex Carey (wk), Glenn Maxwell, Pat Cummins, Ashton Agar, Jhye Richardson, Josh Hazlewood.